VN-Index Technical Signals
In the morning trading session on 21/02/2024, VN-Index dropped points and broke the 7 consecutive up sessions recently. This is reflected in the index’s movement as continuous tug-of-war appeared in the morning session.
In addition, the trading volume decreased in the morning session, indicating that investors’ sentiment is becoming cautious.
Currently, the Stochastic Oscillator indicator has given a sell signal in the overbought zone. This indicates that the short-term correction risk will appear in the near future if the indicator falls out of this zone.

HNX-Index Technical Signals
In the trading session on 21/02/2024, HNX-Index dropped points and showed the Inverted Hammer candlestick pattern, indicating the investors’ lack of optimism.
Furthermore, the return of foreign investors’ net selling increased the risk if this continues in the future.
The Stochastic Oscillator indicator has entered the overbought zone, so the upcoming risk will be high if a sell signal appears.
AAA – An Phat Xanh Plastic Joint Stock Company
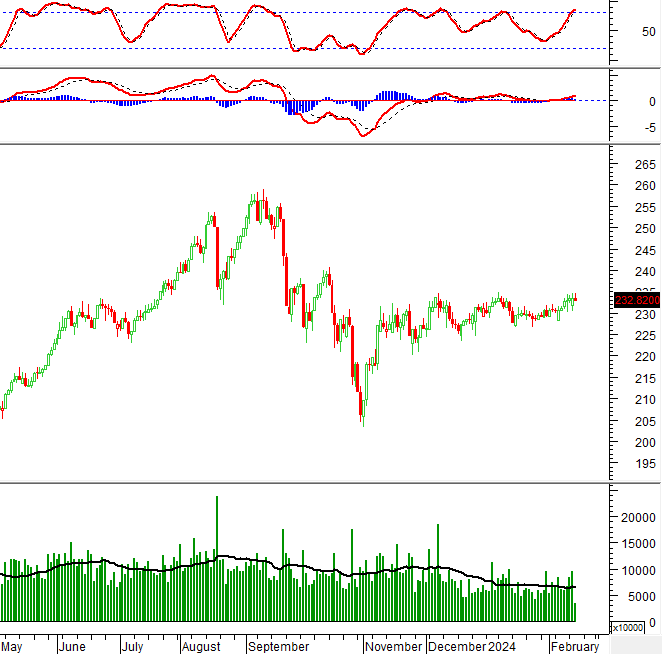
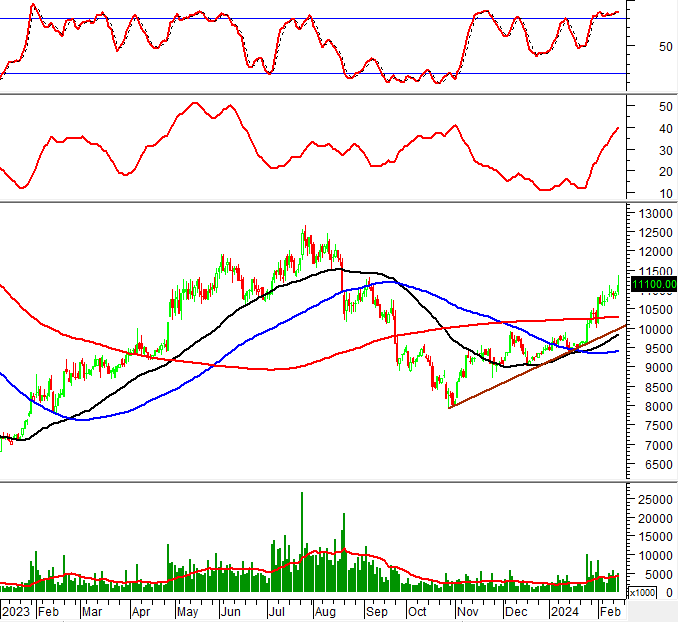
In the morning session on 21/02/2024, the AAA stock continued to rise after the Golden Cross appeared between the 50-day SMA and the 100-day SMA, accompanied by volume exceeding the 20-day average in the morning session, reflecting investors’ positive sentiment.
In addition, the Stochastic Oscillator indicator continues to move up after giving a buy signal, so the positive outlook still exists.
Currently, the AAA stock is well supported by the medium-term uptrend trendline in the context of the ADX continuing to rise above 30, indicating a strong current upward trend.
KDH – Khang Dien Investment and Trading House Corporation
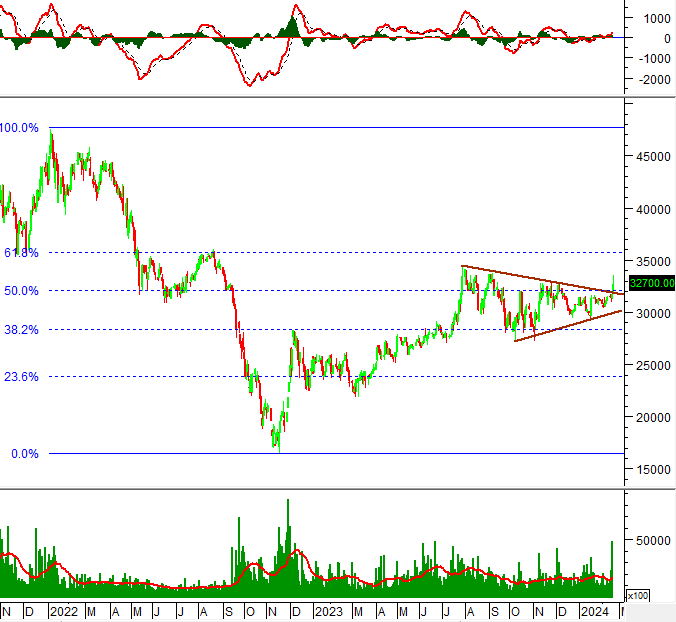
In the morning trading session on 21/02/2024, the price of the KDH stock sharply increased along with continuously improving volume in recent sessions and exceeding the 20-day average, indicating that a large amount of money is flowing back into this stock.
Furthermore, the MACD indicator is still above the 0 threshold and moving up after showing a buy signal, so the upward momentum will be maintained in the near future.
Currently, KDH has broken the upper edge of the Triangle pattern. If the price continues to rise and surpasses the Fibonacci Retracement 61.8% level (equivalent to the range of 34,800-36,000), the potential price target could be the range of 38,800-40,000.
Technical Analysis Department, Vietstock Advisory Office


