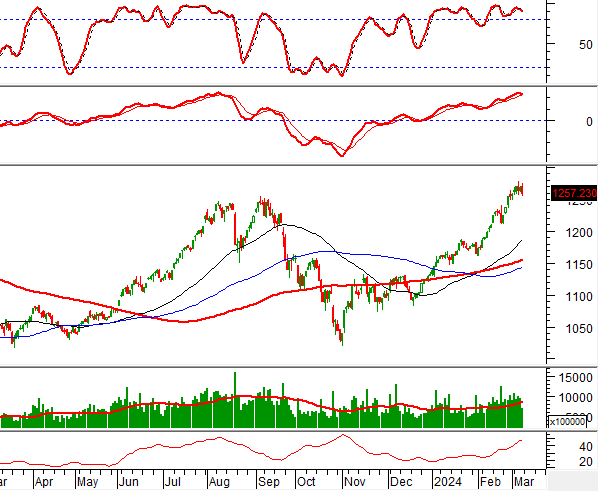
Technical signal of VN-Index
During the morning trading session on March 8, 2024, VN-Index formed a candlestick pattern similar to Bearish Engulfing with increasing trading volume in the morning session and is expected to exceed the 20-day moving average when the session ends, indicating the pessimistic sentiment of investors.
In addition, the Stochastic Oscillator indicator gave a bearish divergence signal, indicating short-term risk. In a cautious scenario, VN-Index may retest the support zone from the previous peak in September 2023 (equivalent to the 1,245-1,255 range).

Technical signal of HNX-Index
During the trading session on March 8, 2024, HNX-Index formed a High Wave Candle pattern accompanied by high trading volume and is expected to exceed the 20-day moving average, indicating a market in consolidation.
However, the MACD indicator is narrowing the distance to the Signal line. If the indicator gives a bearish signal, the prospects will be less optimistic.

DGW – Digital World Corporation
During the morning trading session on March 8, 2024, the stock price of DGW increased significantly with volume in the morning session exceeding the 20-day moving average, indicating positive investor expectations.
In addition, the MACD indicator, after giving a buy signal, continues to rise, indicating that the upward trend is still ongoing.
Currently, the stock price of DGW is testing the upper edge of the bullish price channel, which is also the previous peak in October 2023 (equivalent to the 60,000-62,000 range). In a positive scenario, the stock price is likely to be maintained and break through this resistance zone.

SMC – SMC Investment and Trading Corporation
During the morning session on March 8, 2024, the stock price of SMC continued to rise with a surge in trading volume in the morning session, surpassing the 20-day moving average and the previous session.
In addition, the stock price has broken out of the accumulation zone from November 2023 until now (equivalent to 10,000-11,000), and also surpassed the 200-day SMA, which is a strong resistance. This indicates that a new uptrend is likely forming.
Currently, the MACD and Stochastic Oscillator indicators have given a buy signal and continue to trend upwards, indicating a high likelihood of sustained recovery in the upcoming sessions.

Technical Analysis Department, Vietstock Advisory Division


