Negative signals are increasing
The market is showing more short-term negative signals, suggesting a potential downside.
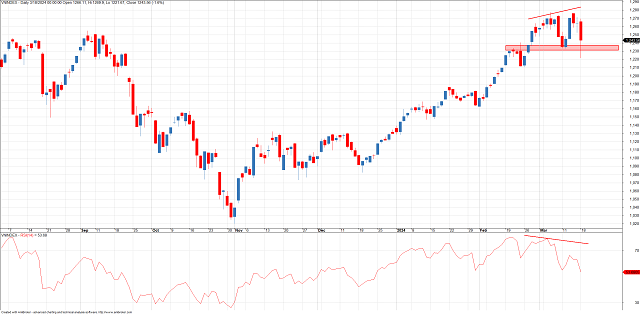
Divergence between price and indicators. The market had a recovery last week and retested the previous peak at 1,275 points. However, the index formed a bearish divergence. The VN-Index has been trending up, forming higher highs. But some momentum indicators (STO, RSI, etc.) are trending down, forming lower highs. In Figure 1, the divergence between price and RSI is evident. This creates a warning signal for a short-term correction.
Double top pattern? The index failed to break through the 1,275 points level last week, accompanied by a strong correction in the early sessions. At some point, the VN-Index dipped below the 1,230 points level. This suggests the possibility of a double top pattern. Especially when the volume is increasing. If this pattern is confirmed, the target price will be around 1,180-1,200 points.
|
Figure 1. The double top pattern and divergence
|
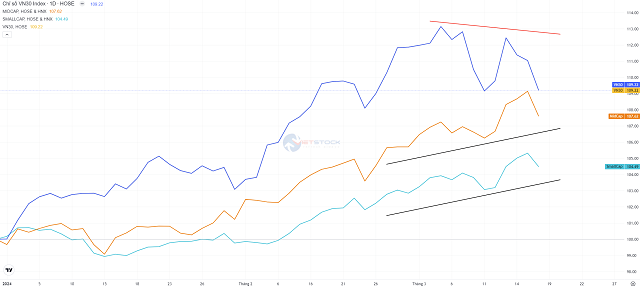
Divergence among stock groups. According to Dow Theory, market indices must confirm each other, either rising or falling together. When indices do not confirm each other, it signals a potential reversal of the current trend. In this case, we can easily observe the divergence between VN30, VNMID, and VNSML. These three indices represent three groups of stocks with different market caps: large-cap, mid-cap, and small-cap. Currently, the VN30 index is trending down, forming lower highs and lows. While the VNMID and VNSML indicators still show recovery and have not formed lower lows. This divergence implies that either VN30 needs to rebound to confirm the recovery trend, or the other two indices will have to correct to confirm the upcoming downtrend phase.
|
Figure 2. Divergence among stock groups
|
Will the market correct?
It is too early to say that the market will start correcting. Investors using technical analysis tools/techniques need to be aware that these tools/techniques have their own characteristics. Specifically:
First, divergence is a phenomenon that generates a warning signal about the current trend, not a confirmation signal for buying/selling actions due to the divergence between price and indicators having a high degree of “noise” (false signals).
Second, the double top pattern is still in the forming stage, but it has not been confirmed. Therefore, this is just an observation pattern, and we should only act when the closing price is below the 1,230 points level. Then the pattern will be truly confirmed.
Third, the divergence between the VN30 index and the VNMID and VNSML indicators implies two scenarios for the market: either VN30 must turn upward to confirm the current recovery trend, or the other two indices must turn downward to confirm the upcoming short-term correction.
Thus, these signals only serve as a warning for the potential appearance of a short-term correction. It cannot be confirmed whether the downtrend has formed at this moment. However, investors need to understand that the increased presence of these reversal signals implies increasing risks, and it is necessary to prepare for the upcoming “difficult” phase. In addition, the short-term downtrend will be officially confirmed if the VN-Index corrects below the 1,230 points level, with the nearest target according to the double top pattern being around 1,180-1,200 points.
The game is not over yet?
If a short-term correction is formed, investors should consider it as a technical correction phase rather than the beginning of a longer-term correction. The upward trend will continue for the remainder of 2024. The medium and long-term uptrend is strongly supported by fundamental factors such as (1) the economic recovery, (2) expansionary fiscal and monetary policies, (3) FDI capital inflows, etc.
This implies that the correction phase will bring stock prices back to lower levels, providing an opportunity for investors to accumulate stocks for medium and long-term positions.
Tran Truong Manh Hieu – Head of Stock Analysis at KIS Vietnam


