


: Mixed Signals Emerge")

: Short-Term Outlook Continues to Deteriorate")
STOCK MARKET REVIEW FOR THE WEEK OF 17-21/06/2024
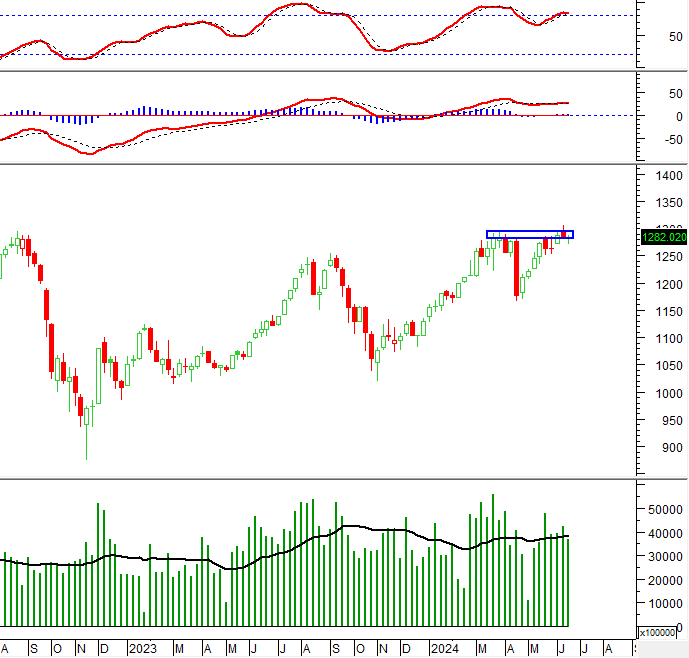
During the week of 17-21/06/2024, the VN-Index ended with a Doji candlestick pattern as the Stochastic Oscillator indicator dipped into overbought territory, potentially signaling a sell-off.
Currently, the index is testing the March 2024 high (around 1,280-1,295 points) for the third consecutive week. To maintain its upward trajectory, the index needs to break out of this range.
TECHNICAL ANALYSIS
Trend and Price Oscillation Analysis
VN-Index – Bollinger Bands Continue to Narrow
On 21/06/2024, the VN-Index fluctuated, testing the Middle Bollinger Band, while the bands themselves narrowed, and trading volume remained below the 20-day average, indicating investor uncertainty.
Additionally, the ADX indicator remained below 20, suggesting a very weak trend. The index is likely to continue trading sideways and exhibiting mixed performance in the coming sessions.
The MACD indicator still points downward and previously gave a sell signal, so the risk of a correction remains. The Fibonacci Projection level of 61.8% (approximately 1,245-1,265 points) should provide short-term support for the VN-Index going forward.

HNX-Index – Near Inverted Hammer Candlestick Pattern
On 21/06/2024, the HNX-Index rose slightly and formed a candlestick pattern resembling an Inverted Hammer. It has consistently traded below the Middle Bollinger Band, while trading volume has been below the 20-day average in recent sessions, indicating a lack of investor optimism.
Moreover, the MACD indicator triggered a sell signal after a bearish divergence, suggesting a less-than-positive outlook.
The index remains above the 50-day and 100-day SMA, which should provide support in the coming period if a short-term correction occurs.

Money Flow Analysis
Smart Money Flow Variation: The Negative Volume Index for the VN-Index has crossed above the 20-day EMA, reducing the risk of a sudden downturn (thrust down).

Foreign Money Flow Variation: Foreign investors continued to sell on 21/06/2024. If this trend persists in the coming sessions, the outlook will turn more bearish.
Technical Analysis Department, Vietstock Consulting


