Technical Signals for VN-Index
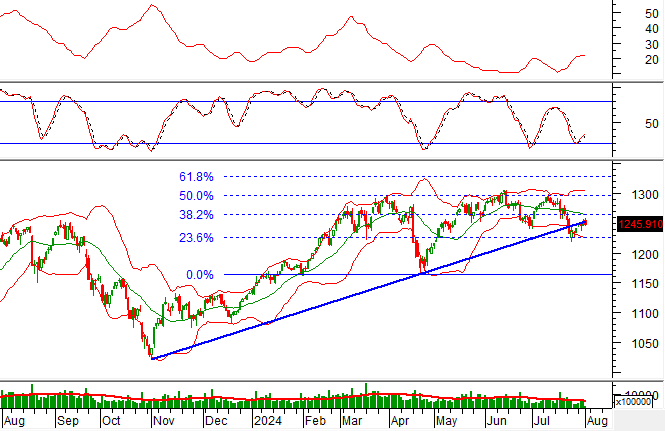
In the morning trading session of August 1, 2024, the VN-Index witnessed a decline, accompanied by a slight drop in trading volume. This indicates a cautious sentiment among investors.
At present, the VN-Index is retesting the Fibonacci Projection 23.6% threshold (corresponding to the 1,225-1,235 point region) while the ADX indicator fluctuates within the gray zone (20<>25). This suggests a period of consolidation with alternating rises and falls likely to persist in upcoming sessions.
Technical Signals for HNX-Index
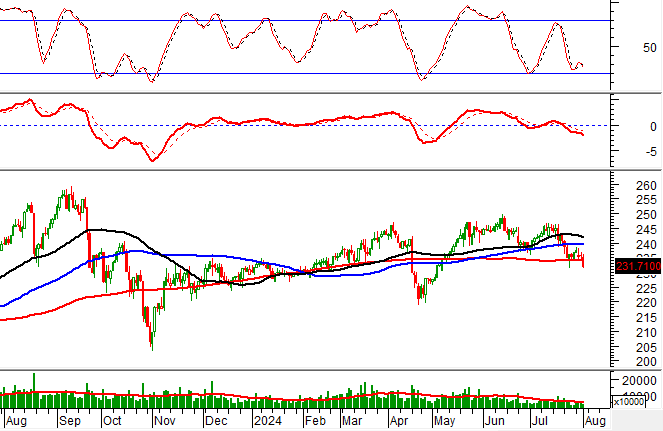
On August 1, 2024, the HNX-Index witnessed a decline, along with a significant increase in trading volume during the morning session, reflecting investors’ pessimistic sentiment.
Additionally, the HNX-Index dipped below the SMA 200-day moving average, while the MACD indicator continued its downward trajectory after previously triggering a sell signal. This suggests that the current trend is likely to persist in the upcoming sessions.
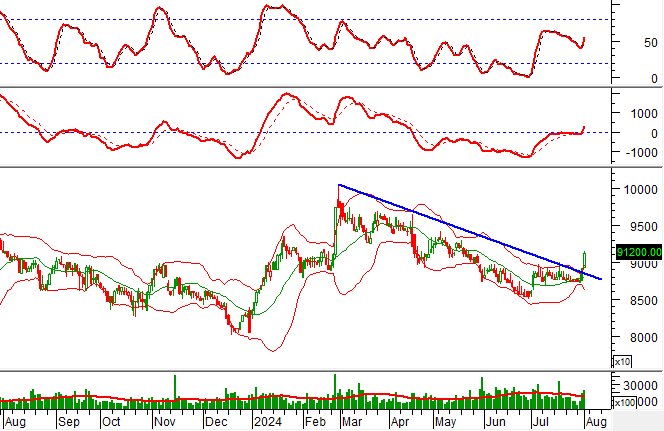
VCB – Vietnam Joint Stock Commercial Bank for Industry and Trade
On the morning of August 1, 2024, VCB witnessed an upward surge, accompanied by above-average trading volume, indicating active participation from investors.
Furthermore, the stock price broke out of its short-term downward trendline, and the Stochastic Oscillator continued its upward trajectory after generating a buy signal earlier. This reinforces the recovery momentum for the stock.
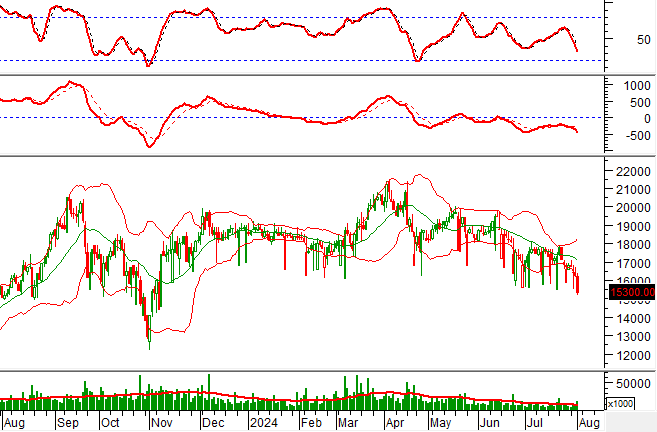
SHS – Hanoi-Sai Gon Securities Joint Stock Company
During the morning session of August 1, 2024, SHS experienced a sharp decline and formed a Black Marubozu candlestick pattern, with trading volume exceeding the 20-session average. This reflects investors’ pessimistic sentiment.
Additionally, the stock price remains close to the lower band of the Bollinger Bands, while the MACD indicator continues to widen the gap with the signal line after triggering a sell signal earlier. This suggests a high probability of the downward trend persisting in the upcoming sessions.
Technical Analysis Team, Vietstock Consulting Department
Investing in a volatile market: Should beginners consider putting money into high-yield bonds for 10-30% yearly profit?

Short-term stock market trading has proven to be a risky venture for many investors, leading to substantial losses. However, there are a few select open funds that have managed to achieve impressive returns, reaching up to 30%.


