Global financial markets have been in turmoil over the past few days, triggered by an earlier-than-expected rate hike by the Bank of Japan and a concerning US non-farm payrolls report, which sparked fears of an impending US recession. Adding to the turmoil, tensions in the Middle East and geopolitical risks escalated following the death of a top Hamas leader in Iran a few days earlier (July 31) amid ongoing conflict.
In a mix of fear and panic, over two days (August 2 and 5), the MSCI AC World Index dropped by 5%, the three major US stock indexes fell by 4-6%, while Japan’s Nikkei plunged by nearly 18%. During this time, the Japanese yen appreciated by 3.5% against the USD (having risen over 10% from its lowest point of 161.69 on July 10) as the US dollar index (DXY) declined by 1.7%. Yields on US 2-year and 10-year Treasury bonds fell by 22.8 basis points and 18.7 basis points, respectively. The CHF strengthened by around 2% against the USD over those two days (rising nearly 6% from its weakest point earlier in July). The volatility index (VIX), often referred to as the “fear index,” surged to 38.57 on August 5, its highest level since November 2020, as fear gripped the markets, although it has since eased back towards levels seen in late 2022.
Concerns about an economic recession in the US were sparked by a worrying jobs report last Friday (August 2), which showed that job creation had slowed significantly to 114,000 in July. More alarmingly, the unemployment rate rose for the fourth consecutive month, climbing from 4.1% to 4.3% (the highest since October 2021) as the number of unemployed people increased by 352,000 in July (possibly partly due to the impact of Hurricane Berly, which hit the US in July). This spike in US unemployment pushed the Sahm index beyond its threshold, flashing a recession signal.
Fears of a “Hard Landing”
The Sahm index, which has been a reliable indicator of past US recessions, posits that if the US unemployment rate (in the form of a three-month moving average) rises by at least 0.5% from its 12-month minimum (3.5% in this case), then the economy is in or about to be in a recession. This indicator was “triggered” when the latest unemployment rate jumped to 4.3% last Friday.
The activation of the Sahm indicator led to a sharp sell-off in US stock markets last Friday (August 2), which accelerated on Monday (August 5) due to concerns about an impending US recession or even a “hard landing,” resulting in a significant market repricing with analysts adjusting their forecasts for deeper and more frequent Fed rate cuts. The major US stock indexes later pared some of these losses on Tuesday (August 6), but the overall five-day loss remained over 3%.
Current Data Indicates a Stable US Economy
Returning to the discussion of the Sahm index, while it has strong predictive power, we also need to acknowledge that it only tells us about timing and cannot reveal the “degree” or “severity” of a recession. To gauge the depth of a US recession, we need to examine current data to see if there are any significant changes or downturns. In summary, so far, there is little to suggest an imminent severe downturn or “hard landing.”
Using the six key US economic indicators monitored by the National Bureau of Economic Research (NBER), the overall picture still points to robust performance compared to the averages of previous cycles. It can be argued that US growth is peaking or has peaked, but there is little to no evidence of an impending hard landing. It is worth noting that the NBER’s Business Cycle Dating Committee, responsible for determining the start and end of US business cycles, does not rely on the common definition of a “technical recession” in its assessments but takes into account these six economic indicators, among other data.
Another important point is that financial stress indicators (until the latest global stock sell-off) have remained low despite the Fed’s aggressive tightening since 2023.
Stay Calm and Monitor, Don’t Get Caught in the Market Storm: Maintain Fed Forecast of 2 Rate Cuts in 2024
UOB assesses that recent economic data presents a mix of a cooling US economic activity and a softening labor market, along with continuing disinflation, which is sufficient to warrant our scenario of the Fed embarking on an easing cycle in September. However, the data does not appear weak enough to suggest deeper or even emergency rate cuts by the Fed, and overall, it still points to a soft landing scenario. Hence, the sell-off and panic in global financial markets over the past few days seem overdone and detached from fundamentals, not yet signaling any major downturn based on available data and evidence.
However, it remains uncertain when the negative sentiment will subside and give way to a more rational environment. Hence, upcoming US data releases, including CPI (August 14), PCE (August 30), and non-farm payrolls (September 6), will be crucial reports to gauge the health of the US economy. Any rapid changes in the data are sure to drive market sentiment. The annual Jackson Hole economic symposium (August 24-26) will be another forum to watch for the latest projections from many major central banks. In the meantime, stay calm and monitor the situation, avoiding getting caught in the market storms.
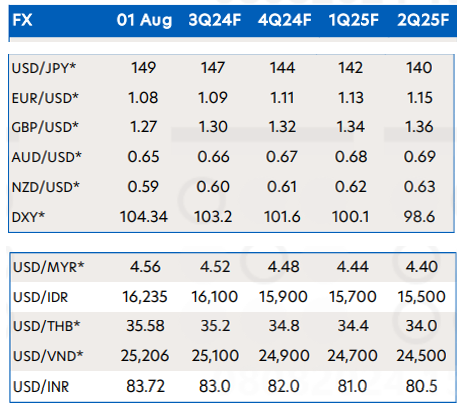
In the absence of a significant deterioration in fundamentals and data, UOB reiterates our forecast of two 25-basis point rate cuts in 2024 (during the FOMC meetings in September and December) and four 25-basis point cuts by 2025. However, we note that the risk of the Fed “cutting more” remains, although the Fed’s policy moves will largely depend on the data. Additionally, we maintain our current forecast for exchange rates and interest rates through Q2 2025. We predict the USD Index will fall to 101.6 by the end of 2024, with EUR/USD heading towards 1.11 and USD/JPY at 144 by the end of Q4 2024.

Han Dong
Which region has the largest and smallest wealth inequality in the country?
With a staggering 11-12 times difference in income, this individual earns in a month what others make in a whole year.


