


According to market experts and participants, the issue of pricing when investing in corporate bonds, in particular, and debt instruments, in general, can be resolved if the market forms a standard yield curve that reflects the correlation between risk and return on investment.
LACK OF PRICING TOOLS MAKES “GOLD AND BRASS ALIKE”
According to statistics from FiinGroup’s Bond Portal system, the actual investment profits of many corporate bond codes listed on the HNX in the past year ranged from 10% to 17%, depending on the issuing organization. In particular, there are bank bond codes that bring profits of 13-17%/year to investors. In contrast, there are corporate bond codes in the real estate industry that only bring profits of 6-7%, even recording losses after one year of holding.
Before exploring the reasons for this discrepancy, analysts point out that investors need to understand the mechanism of bond pricing in the secondary market.
Typically, when an investor owns a bond issued at a nominal interest rate of 10%/year, there is an expectation that the investment will bring profits equivalent to the above-mentioned nominal interest rate.
However, in the financial market, things are not that simple and smooth. It is quite possible that after a period of issuance, the issuing organization encounters liquidity difficulties and cannot pay interest and principal to investors.
This situation raises two issues.
First, after being declared and traded on the HNX, what will be the yield-to-maturity of the traded bond, and how will it compare to the 10% nominal interest rate that investors will receive, and to other investment channels?
The Hanoi Stock Exchange’s corporate bond trading platform (Cbonds, HNX) was established to update information on bond buying and selling in the secondary market.
In the above example, let’s assume that company A encounters difficulties, and its bonds are no longer traded at a face value of 100,000 VND but only at 90,000 VND (clean price). Thus, for investors holding from the beginning, a significant loss will be recorded if sold in the secondary market, as the market trades at a higher risk premium for company A’s bonds.
Although Vietnam’s bond market currently has a government bond yield curve, analysts argue that this curve does not accurately reflect the dynamics of the capital market because investors in the government bond market are not diverse enough, mainly consisting of commercial banks, insurance companies, and the State Treasury.
On the other hand, when a new investor buys the bond at a clean price of 90,000 VND in the secondary market, the profit achieved until maturity will be higher than 12%/year (assumed).
However, the HNX only lists the trading price of the bond (dirty price) and not the data on the clean price or yield-to-maturity (YTM). Therefore, it is challenging for investors to determine whether the bond is “expensive” or “cheap.” In the above example, investors looking at the trading price of 90,000 VND will not know the yield-to-hold-to-maturity.
In an interview with VnEconomy, many experts and market participants opined that Vietnam’s corporate bond market lacks a database to support risk management. This includes a database for calculating yield curves for reference. Currently, the Vietnamese market still uses a 12-month savings interest rate plus an average risk premium ranging from 2% to 5%, depending on the type of corporate bond.
Returning to the example mentioned above, due to the absence of a yield curve for reference, many investors, especially individual investors, consider a 10%/year nominal interest rate attractive, twice the bank deposit rate, and thus invest in corporate bonds. Still, it turns out that the enterprise is high-risk; at that point, they thought they had bought cheap bonds, but in reality, they became expensive. In the booming market phase, some issuing enterprises took advantage of the market’s lack of information and offered bonds with attractive interest rates of 9-10%/year, causing individual investors to flock to buy, but in many cases, they could not recover their principal and interest, creating chaos in the market.
Second, what happens if the enterprise does not fulfill its commitment to pay interest and principal as planned, even if the secondary investor buys the bond at a “bargain” price?
In the above example, the buyer of company A’s bond still receives a nominal interest rate of 10%/year but pays less for the bond, so the yield will be around 12%/year. However, the investor may not receive a 12%/year interest rate and the principal amount when the bond matures. If the investor is sure to receive the full interest and principal of the bond when it matures, they have bought the bond at a “cheaper” price than the previous holder. Conversely, if the enterprise continues to weaken and cannot pay the investor interest and principal, the bond becomes “expensive.”
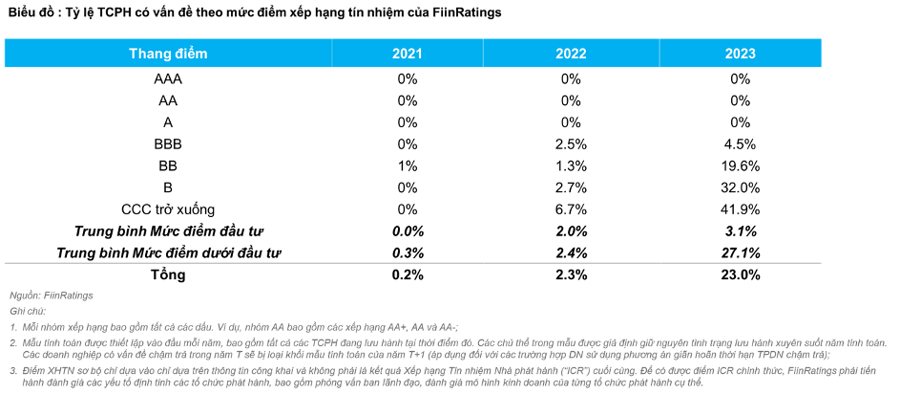
According to the conventions in regional and international markets, historical default data can help the market quantify this risk. This data may be available within each bank, but for market development and common reference, the default ratio published by independent rating agencies is crucial. It serves as an important reference for the market, not just individual investors but also investment funds, in risk quantification; thus, enabling appropriate calculations for risk provisioning and bond pricing determination.
ROLE OF THE YIELD CURVE
According to experts, when data on yield and yield-to-maturity (YTM) of many bond lots by industry and term are collected, a yield curve can be formed.
Dr. Can Van Luc, Chief Economist of BIDV, stated that the yield curve not only helps shape the interest rate level for the market and serves as a reference for issuers and investors in bond pricing but also functions as a “recession barometer” for the economy.
By observing the yield curve, market participants will know the current interest rate level and make predictions about its future direction. A standard yield curve can also support macroeconomic forecasts for the next six months, or even one to two years.
If the yield curve for short-term bonds is higher than the yield for long-term bonds, it indicates that the economy will face difficulties in the near future. On the other hand, if the yield curve is downward-sloping, with long-term bond yields higher than short-term yields, it suggests that the economy will develop normally and stably.”
Dr. Can Van Luc, Chief Economist of BIDV.
Ms. Luong Thuy Ngan, Director of Enterprise Financial Advisory, Vietcombank Securities Company, said that the Cbonds portal of HNX currently publishes information on bond lots of enterprises. Still, the issuing advisory unit often receives inquiries from both investors and issuing units about interest rate differentials.
“From the investors’ perspective, they always ask why the interest rate of this bond is higher than the rate we advised? From the issuer’s side, they wonder why another enterprise in the same industry can issue bonds at a lower interest rate? Every time we receive such questions, we have to investigate the reasons for the valuation differences. Is it because of the product structure, the health of the enterprise’s collateral and finances? What is the purpose of issuing this bond lot?” Ms. Ngan shared.
According to Vietcombank Securities, if there were full credit ratings in the market, the parties would perceive the issue very clearly. The yield curve is a comparative data table used by the market as a reference when investing in corporate bonds to determine whether a bond is expensive or cheap. In developed financial markets, the yield-to-maturity of a bond depends on the issuance term and the credit rating results of the issuing enterprise, and even the rating of the specific bond lot. A higher credit rating means a lower interest rate because it corresponds to a lower default probability. For example, a credit rating of A corresponds to a certain interest rate, while a rating of B requires a higher interest rate… This creates a very good yield curve, and there will be no more questions like this,” said Ms. Ngan.
When compared to the standard yield curve, the issuing organization also knows the reasonable interest rate for its enterprise based on the credit rating results; thus, facilitating a more successful bond issuance and helping the enterprise optimize risk management.
TWO SOLUTIONS TO BUILD A STANDARD YIELD CURVE
Experts emphasize that the yield curve is an essential soft infrastructure for the capital market. All market participants, including (1) issuing enterprises, (2) regulatory agencies, and (3) service providers such as advisory firms and credit rating agencies, need to join hands to build a standard yield curve for the market.
Mr. Nguyen Quang Thuan, Chairman of FiinGroup, said that since the establishment of the HNX secondary bond trading platform, his unit has also started researching and constructing a yield curve.
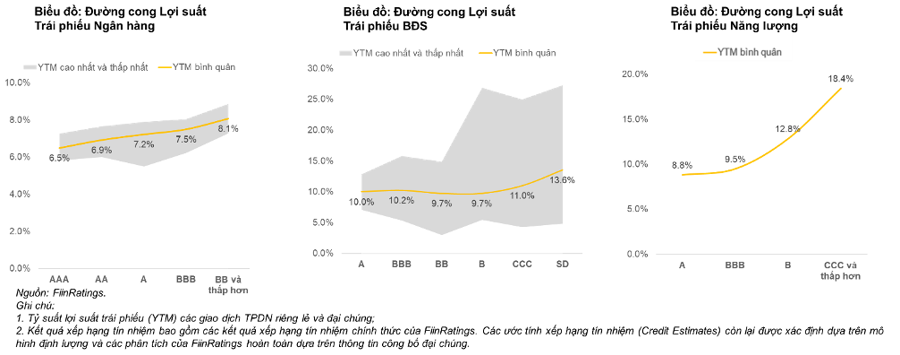
“The basis for the yield curve is the data on the default/delay history of issuing enterprises. For example, bonds issued by enterprises with a credit rating of AAA-AA have a YTM of only 7-8%, while those with a rating of CCC have a YTM of 17-18% because the default rate of these enterprises is up to 40% in the last three years,” said Mr. Thuan.
Analyzing further the role of the yield curve as a reference and forecasting tool, the representative of FiinGroup stated that, unlike audit reports that evaluate an enterprise’s financial situation in the past, credit ratings are based on data to make projections about the enterprise’s future.
Mr. Thuan emphasized the need for the collective effort of all market participants to establish a standard yield curve. Currently, the yield curve being studied by FiinGroup is based solely on data published on the HNX in the last three years.
“The credit rating announcements of international and domestic organizations indicate that enterprises have achieved a long-term credit rating of A, implying that the enterprise’s risk is low in the next 24-36 months, with a default probability of about 5-6%. Enterprises with a credit rating of AAA-AA have an even lower default probability.”
Mr. Nguyen Quang Thuan, Chairman of FiinGroup
According to experts, the reliability of the yield curve depends largely on the liquidity and nature of the transactions in the market.
Firstly, the state management agency needs to have a mechanism to recognize, separate, and publicly disclose repo transactions (buy-sell-back agreements) in the market.
Regarding the nature of the transactions, in reality, in Vietnam’s corporate bond market, there is a common demand for transactions before maturity from both professional investors and issuing organizations regarding restructuring rather than buying and holding until maturity. Many bank bonds, for example, are traded with a nature similar to repo transactions. To calculate a standard yield curve, it is necessary to distinguish between outright transactions (outright purchases) and repo transactions (buy-sell-back agreements)
Secondly, regarding liquidity in the corporate bond market, analysts have observed that the management agency has established a secondary bond trading platform, likened to a “bond market.” However, the goods have been placed on the shelves but not labeled, and there are still few buyers… Hence, the “market” remains sluggish.
Therefore, analysts recommend that the management agency implement multiple solutions to expand the institutional investor base for the corporate bond market by (1) continuing to enhance market transparency and (2) adjusting some regulations related to corporate bond investment at certain institutions such as banks, insurance companies, or pension funds; and (3) promoting the role of “buyer of last resort” to lead and orient the market of funds and state-owned enterprises.
According to Mr. Nguyen Quang Thuan, risk control for institutions such as banks and insurance companies is necessary but only a short-term solution. In the long run, the market needs to be transparent to attract institutional investors…
“For instance, when the market is transparent and has a standard yield curve, instead of prohibiting commercial banks from investing in real estate corporate bonds, the State Bank can ban credit institutions from investing in non-investment-grade bonds. According to experts, in developed financial markets, governments also “go to the market” through state financial institutions. These state-owned institutions not only seek profits but also play a role in orienting the market according to good practices and international standards.
Nam A Bank achieves key targets for 2023, poised for breakthrough in the new year.

With a sustainable development strategy, Nam A Bank (code NAB) has achieved its key targets in 2023, ranking among the top 12 joint-stock commercial banks with the highest growth rate and creating a stable momentum for its new journey.
Bond Market: Investing in “Gold Bonds” despite interest rates lower than 0.5 – 1%

Positive actions from the issuing organization and policies from regulatory agencies have indicated that the most difficult period for the corporate bond market has passed. Despite challenges, the corporate bond market is reemerging as a highly promising investment product.


