According to the General Statistics Office, in August 2024, the total import and export turnover of goods reached an impressive 70.65 billion USD, marking a 0.8% increase from the previous month and a significant 13.5% surge compared to the same period last year.
For the period of January to August 2024, the total import and export turnover of goods stood at 511.11 billion USD, reflecting a notable 16.7% rise year-on-year. Exports increased by 15.8%, while imports grew by 17.7%.

Zooming in on export performance, August 2024 witnessed a preliminary figure of 37.59 billion USD in export turnover, indicating a 3.7% rise from the previous month. The domestic economic sector achieved 10.84 billion USD, a 9.8% increase, while the foreign-invested sector (including crude oil) reached 26.75 billion USD, a 1.5% uptick. Compared to the same month last year, export turnover surged by 14.5%, with the domestic economic sector leading the way with a 21.3% jump and the foreign-invested sector (including crude oil) following closely with a 12% increase.
For the first eight months of 2024, export turnover reached a preliminary total of 265.09 billion USD, reflecting a substantial 15.8% year-on-year increase. The domestic economic sector contributed 73.88 billion USD, a 21% increase that accounted for 27.9% of total export turnover. Meanwhile, the foreign-invested sector (including crude oil) attained 191.21 billion USD, a 13.9% rise, making up the remaining 72.1%.
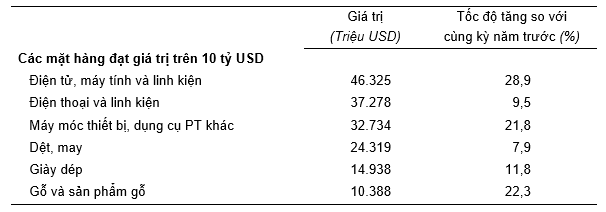
During this eight-month period, 30 export commodities surpassed the 1-billion-USD mark, collectively accounting for 92.3% of total export turnover. Notably, six commodities breached the 10-billion-USD threshold, contributing a substantial 62.6%.

Breaking down the export structure for this period, processed industrial products dominated with a turnover of 233.33 billion USD, accounting for 88% of total exports. Agricultural and forestry products followed with 22.53 billion USD (8.5%), while seafood products contributed 6.31 billion USD (2.4%). Fuel and mineral products made up the remaining 1.1% with a turnover of 2.92 billion USD.
Turning to imports, the picture is slightly different. In August 2024, the country’s import turnover reached a preliminary figure of 33.06 billion USD, reflecting a 2.4% dip from the previous month. However, the domestic economic sector saw a 1.4% increase, reaching 12 billion USD, while the foreign-invested sector experienced a 4.5% decline to 21.06 billion USD.
Compared to August 2023, import turnover increased by 12.4% year-on-year, with the domestic economic sector leading the way with a 13.2% rise, followed by the foreign-invested sector at 11.9%.
For the eight-month period ending in August 2024, import turnover reached a preliminary total of 246.02 billion USD, marking a notable 17.7% increase compared to the same period last year. The domestic economic sector accounted for 89.58 billion USD, a 19.7% increase, while the foreign-invested sector reached 156.44 billion USD, a 16.5% rise.
During these eight months, 38 import commodities were valued at over 1 billion USD each, making up 90.8% of the total import turnover. Notably, two commodities surpassed the 10-billion-USD mark, contributing a significant 40.7%.

Analyzing the import structure during this period reveals that production materials dominated with a turnover of 230.95 billion USD, accounting for 93.9% of total imports. This category includes machinery, equipment, tools, and parts (46.9%) and raw materials (47%). Consumer goods, on the other hand, made up 6.1% of total imports, valued at 15.07 billion USD.
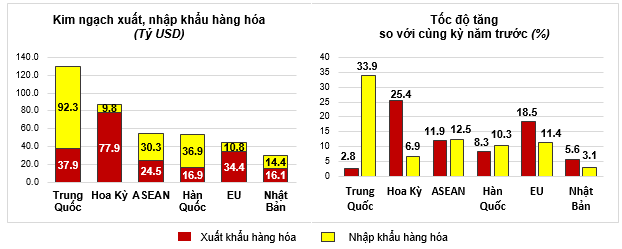
When it comes to trade partners, the United States stood out as Vietnam’s largest export market, with an estimated turnover of 77.9 billion USD. On the import side, China remained the country’s primary source of imports, with a turnover of approximately 92.3 billion USD.

In the first eight months of 2024, Vietnam enjoyed a substantial trade surplus with the United States, estimated at 68.1 billion USD, reflecting a notable 28.6% increase year-on-year. Similarly, the country recorded trade surpluses with the EU (23.6 billion USD, up 22%), and Japan (1.7 billion USD, up 30.5%). However, Vietnam’s trade deficit with China widened to 54.4 billion USD, a 69.6% increase, while the deficit with South Korea and ASEAN also grew, reaching 20 billion USD (up 12.1%) and 5.8 billion USD (up 14.8%), respectively.
In conclusion, the month of August 2024 saw a preliminary trade surplus of 4.53 billion USD. For the period of January to August 2024, the country’s trade balance enjoyed a surplus of 19.07 billion USD (compared to 19.9 billion USD in the same period last year). The domestic economic sector posted a deficit of 15.7 billion USD, while the foreign-invested sector (including crude oil) recorded a surplus of 34.77 billion USD.


