STOCK MARKET REVIEW FOR THE WEEK OF 09/09/2024 – 09/13/2024
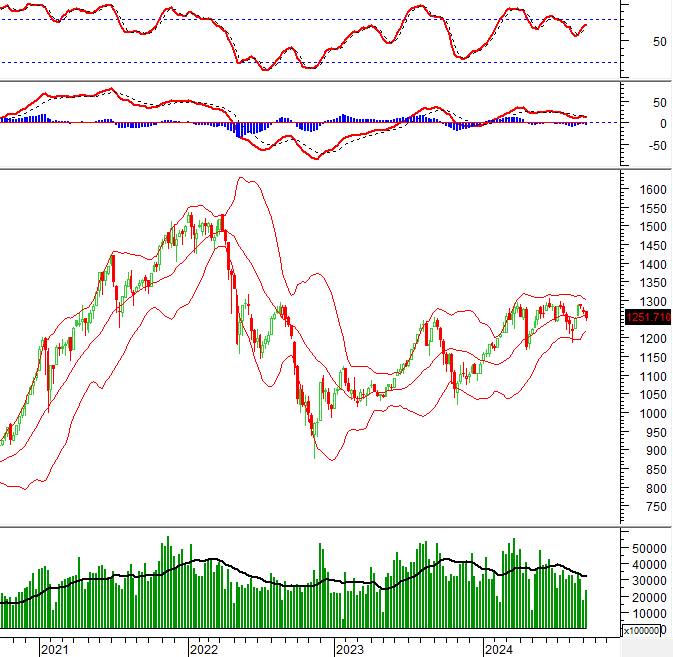
During the week of September 9-13, 2024, the VN-Index witnessed its third consecutive weekly decline, with trading volume falling below the 20-week average. This is a concerning sign as it indicates investor pessimism towards the current market conditions.
Additionally, the index dropped below the Middle line of the Bollinger Bands, while the MACD indicator continues to signal a sell-off. These technical indicators suggest that the short-term outlook remains bearish.

TECHNICAL ANALYSIS
Trend and Price Oscillation Analysis
VN-Index – Death Cross Appears
On September 13, 2024, the VN-Index declined, forming a Three Black Candles pattern accompanied by higher trading volume than the previous session. This reflects investors’ cautious sentiment.
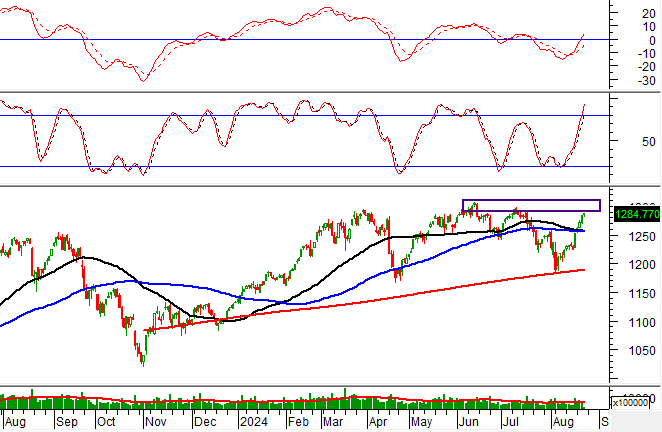
Furthermore, a Death Cross between the 50-day SMA and the 100-day SMA has emerged, while the Stochastic Oscillator has entered the sell zone, falling from the overbought territory. This combination of factors paints a bearish picture.

HNX-Index – MACD Maintains Downward Trajectory
On September 13, 2024, the HNX-Index posted gains, but trading volume remained below the 20-session average, indicating investor uncertainty. The MACD indicator continues to trend downward and remains below the zero line, reinforcing the corrective phase.
Although the HNX-Index rebounded after touching the Lower Band of the Bollinger Bands, it has yet to cross above the Middle line, suggesting that the short-term outlook remains subdued.

Money Flow Analysis
Smart Money Flow Variation: The Negative Volume Index for the VN-Index has crossed above the 20-day EMA. If this condition persists in the next session, the risk of a sudden downturn (thrust down) will diminish.

Foreign Capital Flow Variation: Foreign investors continued to offload holdings on September 13, 2024. If this selling pressure persists in the coming sessions, the market sentiment will likely remain bearish.
Technical Analysis Department, Vietstock Consulting


