The bar graph below illustrates the average annual percentage change of the S&P 500 index during presidential terms since November 1980 (the final year of President Jimmy Carter’s administration).
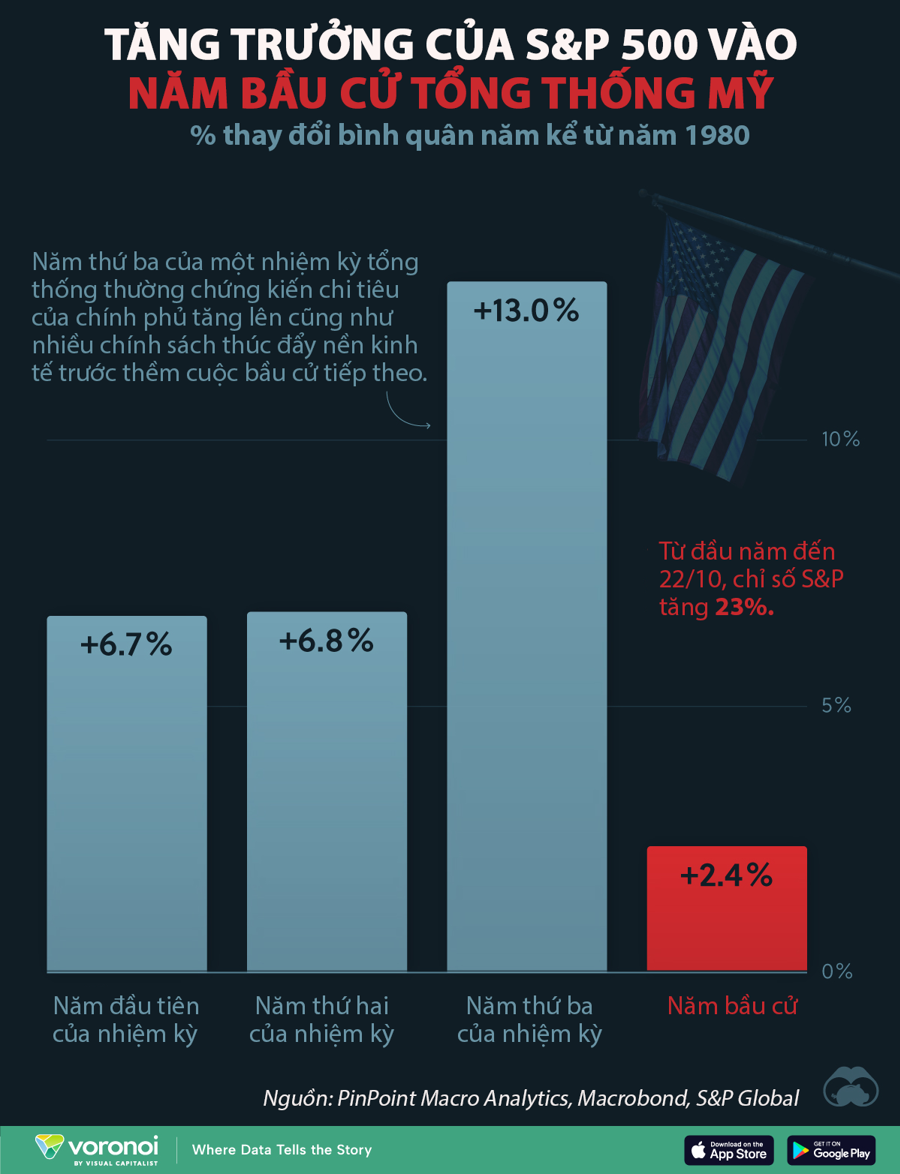
Historically, the third year of a presidential term has been the strongest for the US stock market, attributed to increased government spending and economic policies implemented in the lead-up to the upcoming election.
In contrast, the fourth year, which coincides with the election year, tends to be the weakest. This can be partly explained by the political and economic uncertainties surrounding the election, which often dampen investor sentiment.
It’s important to acknowledge that numerous factors, independent of government policies, influence the stock market’s growth. For instance, during President Joe Biden’s four-year term, the S&P 500’s performance significantly deviated from the average of previous presidential terms, as illustrated below.

Specifically, 2021 witnessed exceptional growth due to low-interest rates and COVID-19 stimulus packages, while 2022 underperformed as the Federal Reserve raised interest rates to combat inflation. The years 2023 and 2024, on the other hand, experienced strong growth driven by a tech stock boom fueled by artificial intelligence advancements.
The Cash Flow Conundrum: Unraveling the Divide in Real Estate’s Portfolio.
Market liquidity eased slightly in the past trading week. Money flow indicated a divergence among real estate stocks.
The Stock Market Optimist: Can We Expect a Revival in Liquidity?
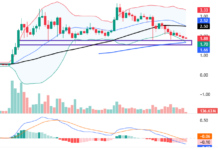
The VN-Index rallied and retested the 100-day SMA. A decisive move above this level, coupled with trading volume surpassing the 20-day average, would reinforce the bullish momentum. Notably, the Stochastic Oscillator has provided a buy signal within the oversold region. If this buy signal persists and the index climbs out of this oversold territory in upcoming sessions, the outlook will turn even more positive.


