Intraday pullbacks have been a consistent feature, with today’s range slightly wider than the previous two days. The ability to curb upward momentum and push prices down indicates selling pressure, but it hasn’t been significant enough to cause substantial damage to the market.
It’s evident that money isn’t flowing in to drive prices up; instead, it’s providing support from below. The lack of substantial buy and sell orders in the contested zone has resulted in a low liquidity threshold for the market. However, this doesn’t imply a shortage of capital; daily liquidity often fails to reflect the true strength of the money flow as it only captures the volume where buying and selling pressures meet at a given time.
Low liquidity still indicates a cautious mindset among investors. At present, a conservative approach involves waiting for a pullback to identify a higher low or a more advantageous entry point after missing the initial rapid upswing. Technically, a retracement is possible, but it requires cooperation from sellers. If stockholders continue to hold their positions, expecting a rise, even small buying power can bring the market into a state of equilibrium, making significant fluctuations unlikely.
In the last three sessions, the market has consistently witnessed intraday declines after peaking early in the session. Prices rise, encounter selling pressure, and close lower. The intraday price decline range reflects profit-taking behavior. Nonetheless, the volume accumulated within this range isn’t substantial, and the overall session liquidity remains modest, suggesting that these are typical transactions primarily driven by short-term traders. It’s also rare for stocks to fluctuate enough to facilitate position reversal.
If this situation persists, it’s likely that the current price level is being maintained due to stockholders’ trading restraint rather than the buying power of investors. A plausible scenario is that the market won’t witness a “test” of the bottom but will instead form a narrow accumulation range. Ultimately, the adjustment process is a phase of contention, aiming to establish a supply-demand equilibrium and gradually shift the expectations of the majority. Markets don’t always move in clear waves – hence the subjective nature of Elliott wave theory and the challenges of applying historical patterns to the present.
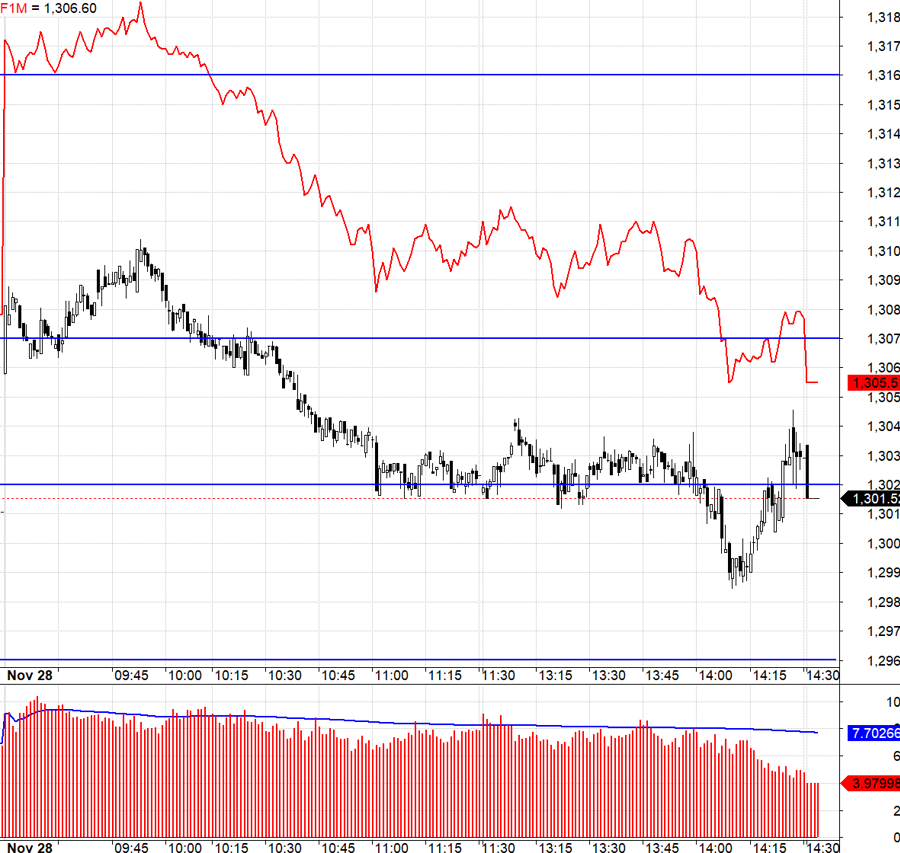
Today, the derivatives market once again anticipated a basis expansion to exploit the wide spread. VN30 opened with a gap and quickly surpassed 1307.xx. Breaking above this level would shift expectations towards 1316.xx, indicating a substantial expansion in the trading range. However, achieving this target requires strong performances from the underlying stocks, and there is considerable selling pressure at higher levels. After the initial basis expansion of over 10 points early in the day, as VN30 climbed above 1307 towards 1310, the basis began to contract. When VN30 retreated to 1307.xx, the spread narrowed to 9 points, and when it dipped below 1307, it stood at 8 points. This setup met the criteria for a Short position with a stop-loss trigger if VN30 regained momentum and pushed above 1307. With such a wide spread, the likelihood of F1 moving counter to VN30 was virtually zero.
VN30 subsequently drifted lower to 1302.xx, with the basis narrowing to approximately 6 points. At this juncture, it was prudent to close at least half of the short position, and the remaining portion could be used to speculate on whether the basis would continue to contract or if VN30 would breach the 1302 support. VN30 oscillated around the 1302 level for an extended period, with the basis alternately contracting and expanding but fundamentally unable to widen further. Ultimately, VN30 did experience a decline below the 1302 level, although the downward momentum failed to push the index to 1295.xx. Nonetheless, closing the short position in this region would have been advantageous.
At present, the likelihood of a market correction remains higher than the prospect of a sustained uptrend. However, predicting the magnitude of this correction is challenging. The issue lies with sellers holding their positions too tightly. In this scenario, the only way to stimulate activity is to influence the underlying stocks. The recommended strategy is to employ a dynamic combination of long and short positions in the derivatives market, with a preference for short positions, while closely monitoring the performance of the underlying stocks.
VN30 closed today at 1301.52. The nearest resistances for tomorrow are 1302, 1307, 1315, 1322, 1327, and 1333. The supports are 1296, 1290, 1283, 1277, and 1271.
“Blog chứng khoán” reflects the personal views of the author and does not represent the opinions of VnEconomy. The perspectives and assessments shared are solely those of the individual investor, and VnEconomy respects the author’s viewpoint and writing style. VnEconomy and the author disclaim any responsibility for issues arising from the investment opinions and perspectives presented in this blog.
The Most Notable Stocks of the Day: A Pre-Market Rundown
“A deep dive into the recent stock market trends: Unveiling the top gainers and losers as per Vietstock’s statistical insights.”
The Power of Persuasive Words: Crafting a Compelling Headline
“Sustaining the Uptrend: A Comprehensive Guide to Navigating the Volatile Market”
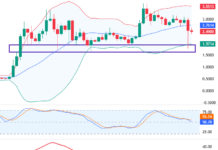
The VN-Index continued its upward trajectory, surging above the Middle Band of the Bollinger Bands. If, in the upcoming sessions, the index sustains its position above this threshold, coupled with trading volumes surpassing the 20-day average, the upward momentum will be reinforced. Moreover, the MACD indicator has flashed a buy signal, crossing above the signal line, boding well for the short-term outlook.
The Market Tug-of-War Continues
The VN-Index witnessed a slight dip with a tug-of-war session, coupled with below-average trading volume. This cautious investor sentiment persists, as reflected by the MACD indicator, which has given a buy signal after crossing above the signal line. In tandem, the Stochastic Oscillator echoes a similar message. Should this momentum be sustained in the upcoming sessions, the outlook may not be as pessimistic as it seems.
Market Beat Nov 1: Sharp Drop, VN-Index Nears 1,250 Points
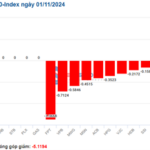
The market closed with the VN-Index down 9.59 points (-0.76%) to 1,254.89, while the HNX-Index fell 0.95 points (-0.42%) to 225.41. The market breadth tilted towards decliners with 480 stocks decreasing and 251 advancing. The VN30-Index basket witnessed a similar trend, with 25 losers, 3 gainers, and 2 stocks referenced.


