
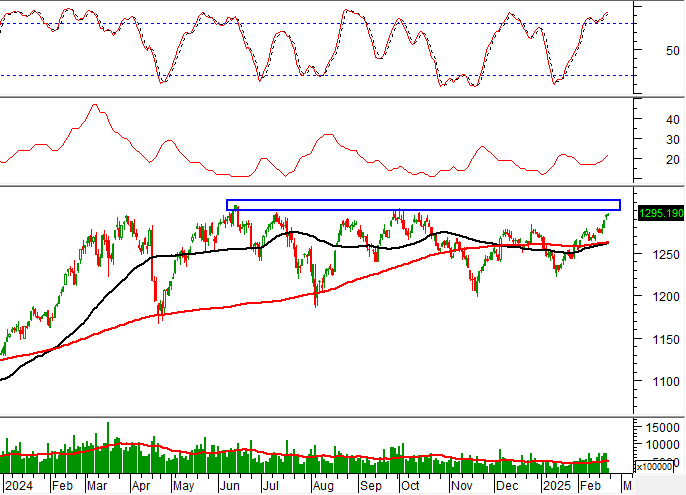
Technical Signals of VN-Index
In the trading session on the morning of February 21, 2025, the VN-Index gained points, but trading volume remained unchanged, indicating investors’ hesitation.
Currently, the VN-Index is heading towards retesting the old peak of June 2024 (equivalent to the 1,300-1,315-point region) while the ADX indicator remains low, suggesting a sideways trend with alternating rising and falling sessions that may continue in the coming sessions.
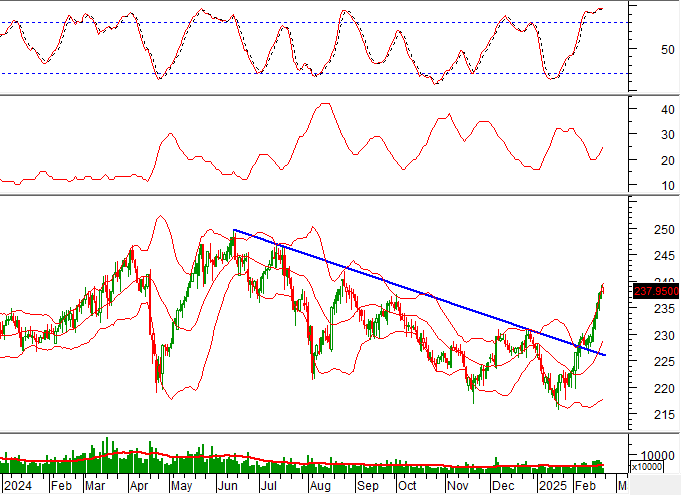
Technical Signals of HNX-Index
In the trading session of February 21, 2025, the HNX-Index lost points and a Doji candlestick pattern emerged, along with a slight decrease in liquidity in the morning session, indicating investors’ caution.
In addition, the HNX-Index is closely following the upper band (Upper Band) of Bollinger Bands, while the MACD indicator continues to rise after previously giving a buy signal, further strengthening the short-term uptrend of the index.
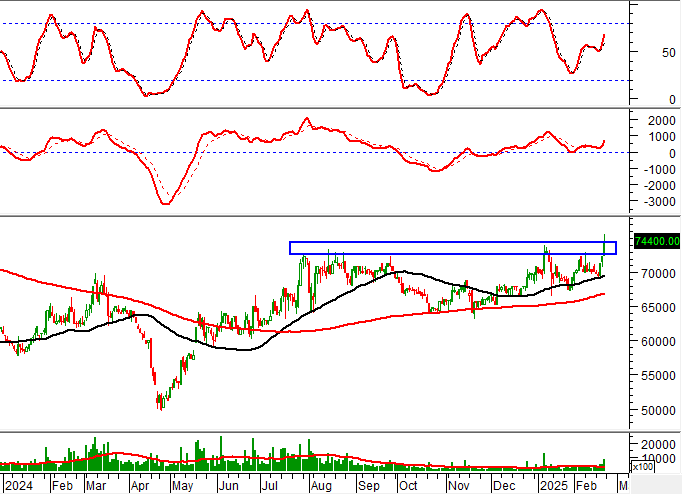
BCM – Industrial Investment and Development Corporation
In the morning session of February 21, 2025, BCM rose in price, along with a strong increase in trading volume, surpassing the 20-session average, indicating active trading by investors.
Currently, the share price continues to head towards retesting the old peak of August 2024 (equivalent to the 72,500-74,500 region) while the MACD indicator is constantly expanding the gap with the Signal line after previously giving a buy signal. If the share price successfully breaks through this resistance region, the short-term upward prospect will be further strengthened.
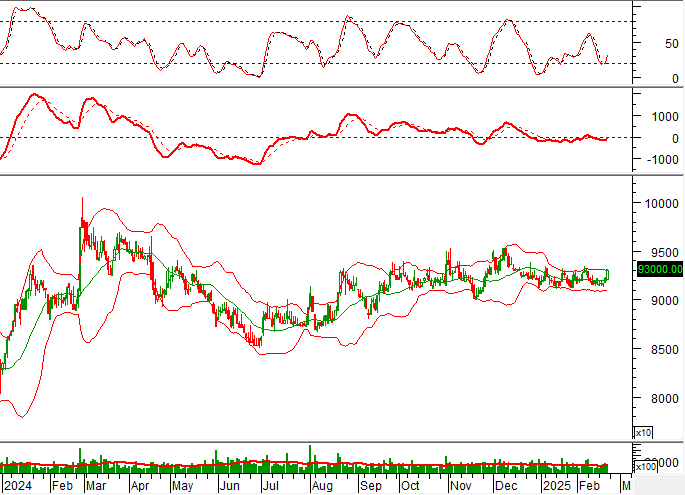
VCB – Vietnam Joint Stock Commercial Bank for Industry and Trade
In the morning session of February 21, 2025, VCB rose in price, with trading volume surpassing the 20-session average, indicating investors’ gradually improving sentiment.
Currently, the share price continues to rebound after breaking above the Middle line of the Bollinger Bands, while the Stochastic Oscillator indicator gives a buy signal again, further strengthening the stock’s short-term recovery prospect.
Analysis Team, Vietstock Consulting Department
– 12:01 21/02/2025
The Market Tug-of-War: Will History Repeat Itself at the Peak?

The VN-Index edged higher, forming a Doji candlestick pattern. This indicates a persistent tug-of-war as the index retests the old peak from October 2024 (1,290-1,305 points). For the uptrend to sustain, the index must breach this zone. Meanwhile, the Stochastic Oscillator ventures deeper into overbought territory. Investors should exercise caution if the indicator flashes another sell signal in the coming days.
Market Beat on Feb 21st: VN-Index Sees Strong Tug-of-War at the Almighty 1,300 Resistance

The market closed with the VN-Index up 3.77 points (+0.29%) to 1,296.75, while the HNX-Index fell 0.45 points (-0.19%) to 237.57. The market breadth tilted towards decliners, with 423 stocks falling versus 359 advancing stocks. The sell-off was more pronounced in the VN30 basket, with 18 gainers, 11 losers, and 1 stock referenced.
The Stock Market Week of February 17-21, 2025: Navigating Intensifying Foreign Investor Pressure

The VN-Index sustained a positive upward trajectory this week, with trading volumes above the 20-day average, indicating brisk investor activity. However, foreign investors continued their selling spree, maintaining a net selling position. If this trend persists, it could significantly impact the market as the VN-Index approaches the crucial resistance level of 1,300 points.
The Market Tug-of-War: Will the Stalemate Finally End?

The VN-Index rose while maintaining a tug-of-war stance following recent alternating sessions of gains and losses. Moreover, with trading volume remaining below the 20-day average, it indicates that investor caution is still prevalent. The Stochastic Oscillator indicator is also signaling a sell-off within the overbought territory, with a potential exit from this zone in the coming period. Should this occur, the risk of short-term corrections persists.
The Stock Market Week of February 10-14, 2025: Foreign Investors Continue Their Selling Spree

The VN-Index concluded a week of volatile trading with a modest gain. The index currently hovers above the 200-day SMA, and trading volume exhibits positive signs of improvement. This indicates a vibrant and active trading environment. However, the prolonged foreign selling streak could hinder the index’s growth trajectory in the coming period.


