
I. MARKET ANALYSIS OF THE STOCK MARKET ON 03/20/2025
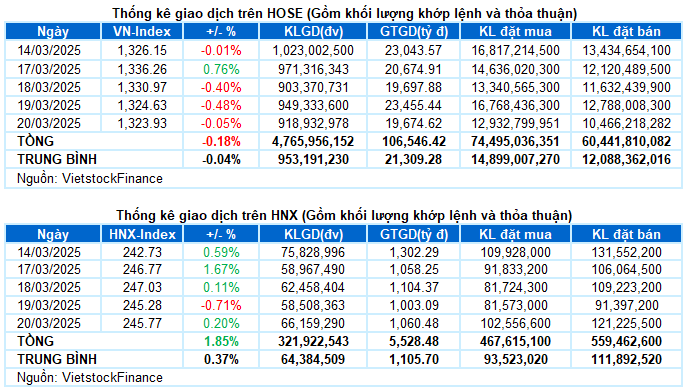
– The main indices hovered near the reference mark during the trading session on March 20. The VN-Index slightly decreased by 0.05%, reaching 1,323.93 points, while the HNX-Index inched up by 0.2% to 245.77 points.
– The trading volume on the HOSE reached over 821 million units, a 1.7% decrease compared to the previous session. On the other hand, the trading volume on the HNX surged by 46.4%, reaching over 66 million units.
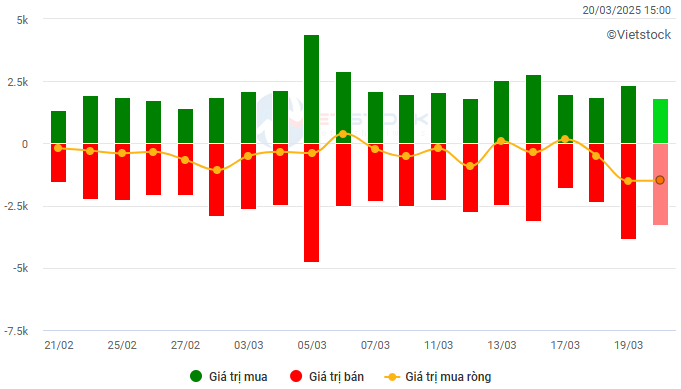
– Foreign investors continued to strongly net sell on the HOSE, with a value of more than VND 1,441 billion, and also net sold nearly VND 14 billion on the HNX.
Trading value of foreign investors on the HOSE, HNX, and UPCOM by day. Unit: VND billion
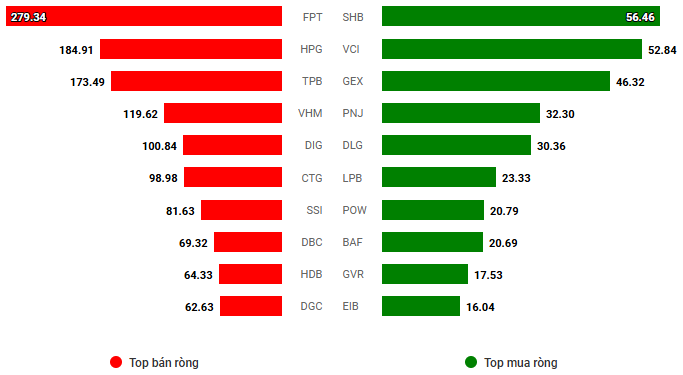
Net trading value by stock ticker. Unit: VND billion
– The market experienced strong fluctuations during the futures expiration session. After the news that the US Federal Reserve (Fed) kept interest rates unchanged and signaled there would be two rate cuts in 2025, the VN-Index reacted quite positively, gaining over 7 points right after the opening. However, the excitement did not last long as buying power weakened, giving way to increased selling pressure, pushing the index down more than 6 points by the end of the morning session. The VN-Index continued to fluctuate below the reference mark in the afternoon session before buying power returned towards the end, helping the index narrow its loss and close near the reference mark at 1,323.93 points.
– In terms of impact, MBB, VCB, and TCB were the stocks that supported the index the most, contributing nearly 1.5 points to the VN-Index. On the other hand, TPB, VIC, and BCM took away more than 1 point from the overall index.
– The VN30-Index edged up by 0.1%, reaching 1,378.95 points. The breadth of the basket was relatively balanced, with 12 gainers, 15 losers, and 3 stocks remaining unchanged. Among them, MBB and STB witnessed the strongest recovery, increasing by 1.7% and 1.3%, respectively. On the flip side, TPB stood out with a plunge of more than 5%, while VJC, BCM, and LPB also corrected by over 1%.
Sectors exhibited mixed performances. On the losing side, real estate continued its notable correction as selling pressure persisted in many stocks, notably VIC (-0.77%), BCM (-1.49%), SSH (-6.34%), PDR (-1.7%), NLG (-2.27%), SNZ (-1.12%), HDG (-1.26%), and IJC, which hit the floor price. This was followed by the consumer staples sector, which also lost around 0.5%, largely influenced by stocks such as VNM (-0.8%), SAB (-0.39%), VHC (-2.05%), SBT (-1.66%), HNG (-2.9%), SEA (-2.56%), and VOC (-14.81%).
In contrast, the discretionary consumer sector led the gainers, although the increase was rather modest, indicating a certain level of divergence. MWG (+0.84%), PNJ (+1.81%), GEX (+4.61%), and GEE (+2.12%) regained strong momentum, while some other stocks still faced corrective pressure, including FRT (-2.22%), PLX (-0.48%), OIL (-1.55%), TLG (-2.5%), TCM (-1.11%), GIL (-1.16%), and DGW (-0.76%).
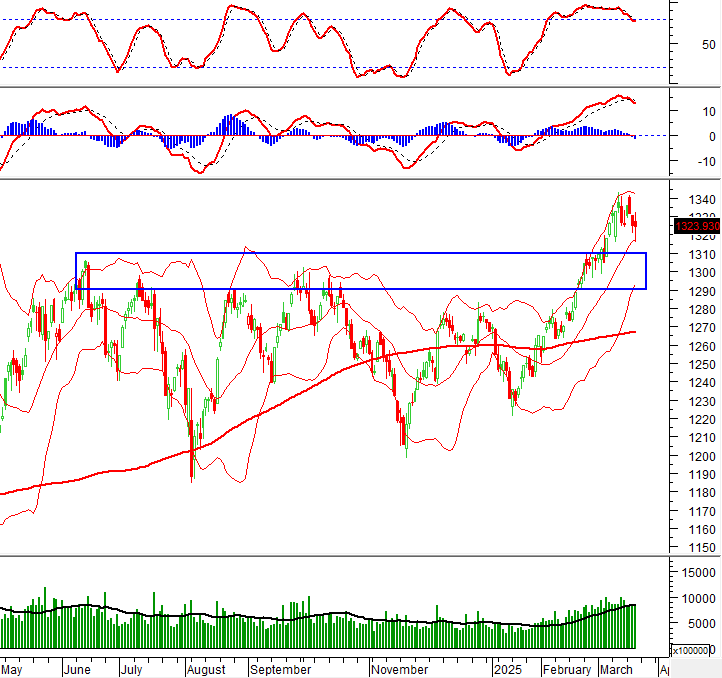
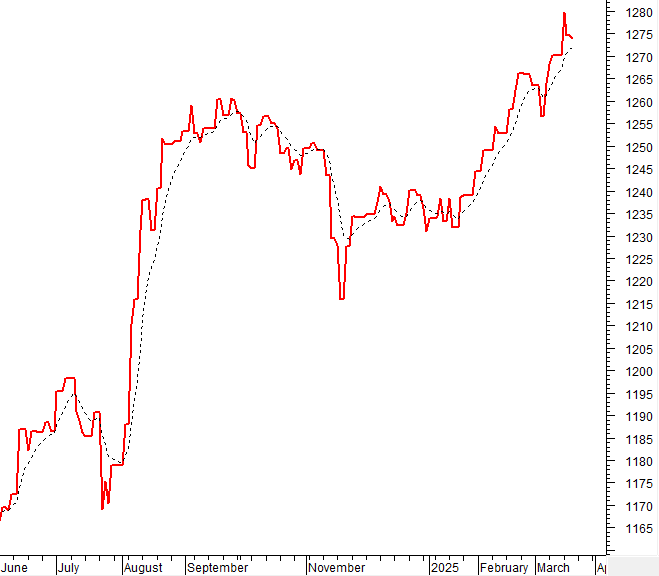
The VN-Index declined with the emergence of a High Wave Candle pattern. At the same time, trading volume consistently remained below the 20-day average, indicating that investors are adopting a cautious approach. Currently, the index is testing the Middle line of the Bollinger Bands. If this level is breached in the upcoming sessions, the situation will become even more pessimistic, and the likelihood of revisiting the old peak breached in June 2024 (equivalent to the 1,290-1,310 point range) will be high. At present, the Stochastic Oscillator and MACD indicators continue to trend downward after generating sell signals. This suggests that the risk of short-term corrections persists.
II. TREND AND PRICE MOVEMENT ANALYSIS
VN-Index – Stochastic Oscillator and MACD maintain sell signals
The VN-Index declined, accompanied by the emergence of a High Wave Candle pattern. Meanwhile, trading volume persistently remained below the 20-day average, signaling investors’ cautious sentiment. At present, the index is testing the Middle line of the Bollinger Bands. If this level is breached in the upcoming sessions, the situation could turn even more pessimistic, heightening the possibility of revisiting the old peak breached in June 2024 (approximately the 1,290-1,310 point range).
Currently, the Stochastic Oscillator and MACD indicators continue to trend downward after generating sell signals, suggesting that the risk of short-term corrections remains.
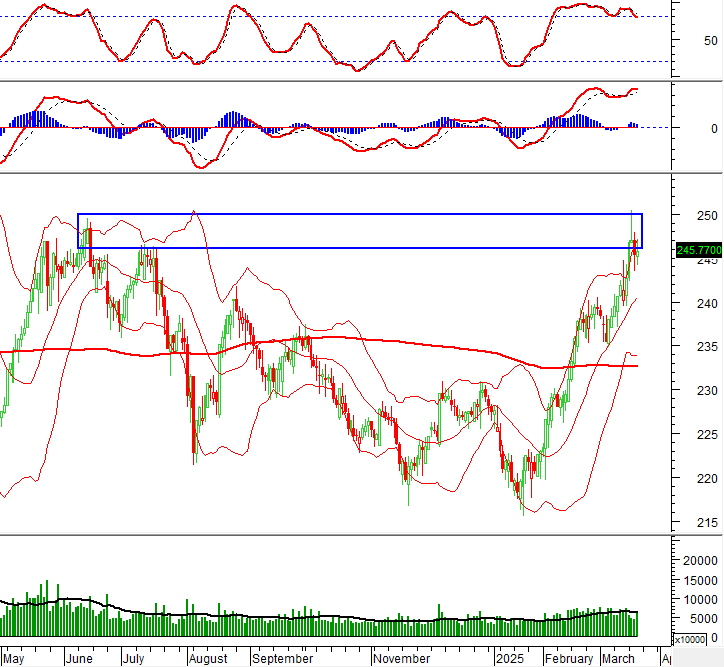
HNX-Index – High Wave Candle pattern emerges
The HNX-Index rebounded with trading volume surpassing the 20-day average. However, the emergence of a High Wave Candle pattern indicates that investors’ doubts remain.
Presently, the Stochastic Oscillator indicator is providing a sell signal within the overbought zone and is likely to exit this zone in the upcoming sessions. Should this occur, the short-term outlook will remain pessimistic.
Money Flow Analysis
Movement of smart money: The Negative Volume Index of the VN-Index crossed above the 20-day EMA. If this status quo is maintained in the next session, the risk of a sudden downturn (thrust down) will be mitigated.
Foreign capital flow: Foreign investors continued to net sell during the trading session on March 20, 2025. If foreign investors maintain this stance in the upcoming sessions, the situation will become even more pessimistic.
III. MARKET STATISTICS ON 03/20/2025
Economics and Market Strategy Analysis Department, Vietstock Consulting
– 17:23 03/20/2025
Technical Analysis for March 18: Indecision Prevails in the Market

The VN-Index and HNX-Index both climbed, while trading liquidity took a significant dip in the morning session, indicating investors’ hesitation in their transactions.
The Cautious Investor: Navigating Market Uncertainty

The VN-Index declined with trading volume dipping below the 20-day average, indicating a cautious sentiment among investors. If this scenario persists in the upcoming sessions, the index is likely to retest the old peak breached in June 2024 (corresponding to the 1,290-1,310 point range). This zone will also serve as strong support for the index. Presently, the MACD indicator is poised to generate a sell signal again as it narrows the gap with the Signal Line. Should this materialize in the coming sessions, the short-term outlook would turn rather pessimistic.
The Ultimate Headline: “The Looming Threat of Market Correction: Navigating the Storm”

The VN-Index witnessed another day of decline with trading volume below the 20-day average. This indicates a heightened sense of caution among investors as the index approaches the old peak of June 2024 (1,290-1,310 points). Currently, the Stochastic Oscillator indicates a sell signal, departing from the overbought region. Similarly, the MACD indicator also suggests a sell signal. Investors are advised to exercise prudence in their investment decisions if the corrective phase persists.
The Crypto Crash: Bitcoin Plunges Below $90,000 as Panic Selling Spreads

The crypto market kicked off 2025 on a pessimistic note, as expectations of Fed monetary policy easing began to fade.
The Crypto Report: February 2025 (Part 1) – A Tale of Mixed Signals
 – A Tale of Mixed Signals")
Introducing our in-depth analysis and insights into the trends of prominent cryptocurrencies that are on every investor’s radar. Our expert team of analysts provides a comprehensive overview of the market, offering valuable information for both short-term and long-term investment strategies. With our meticulous research and market knowledge, we aim to empower investors to make informed decisions and stay ahead of the curve in the dynamic world of cryptocurrency.


