
BNB: Improved Short-Term Signals
On the weekly chart, after peaking in December 2024, BNB pulled back to retest the 50-day SMA while the ADX indicator moved within the gray area (20 < adx < 25).
Additionally, the MACD indicator continues to trend downward and is constantly widening the gap with the Signal line after previously giving a sell signal, suggesting that the downside risk remains.
However, the writer believes that the long-term uptrend is still intact as BNB consistently forms higher highs and higher lows, and the 100-day SMA and 200-day SMA act as strong long-term support levels. 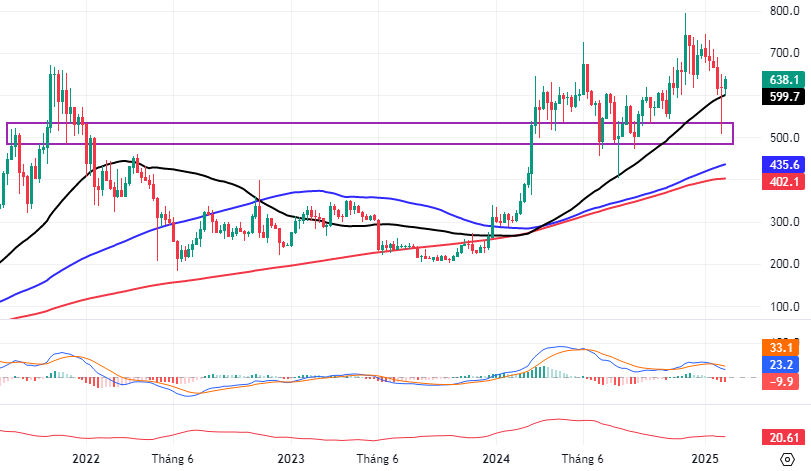
BNB chart for 2021 – 2025 – Source: TradingView
On the daily chart, BNB rebounded after successfully testing the 61.8% Fibonacci Retracement level (corresponding to the $530-575 USD region) as the MACD indicator gave a buy signal again, indicating improved short-term prospects.
Furthermore, BNB is approaching a retest of the Middle Bollinger Band while the Stochastic Oscillator indicator continues to climb after providing a previous buy signal. If it successfully breaks above this resistance level, the recovery scenario could extend in the upcoming sessions.
Based on these signals, the writer suggests that BNB will experience short-term fluctuations before resuming its long-term uptrend in the future.
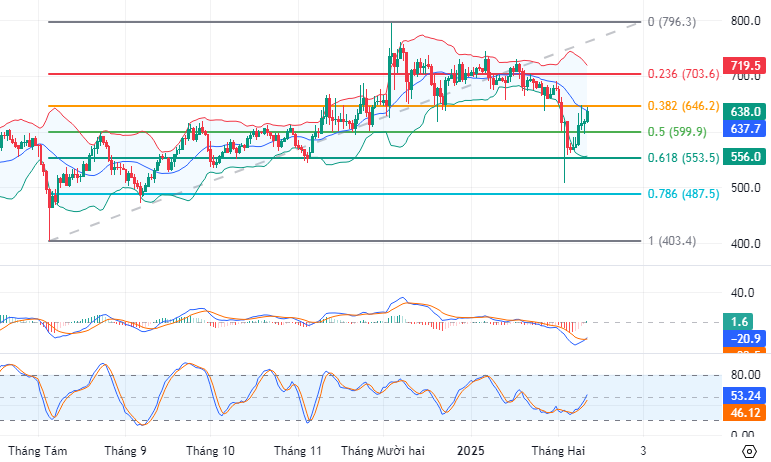
BNB chart for 2024 – 2025 – Source: TradingView
SOL: Range-Bound Action Continues
On the weekly chart, SOL is in the process of retesting its previous high from March 2024 (around $170-220 USD) while the ADX indicator moves within the gray area (20 < adx < 25).
Additionally, SOL continues to trade within a long-term ascending price channel and is trending towards retesting the lower edge of this channel. Meanwhile, the MACD indicator is constantly widening the gap with the Signal line after a previous buy signal. If SOL breaks down and falls below this support level, the downside risk will increase in the upcoming sessions.
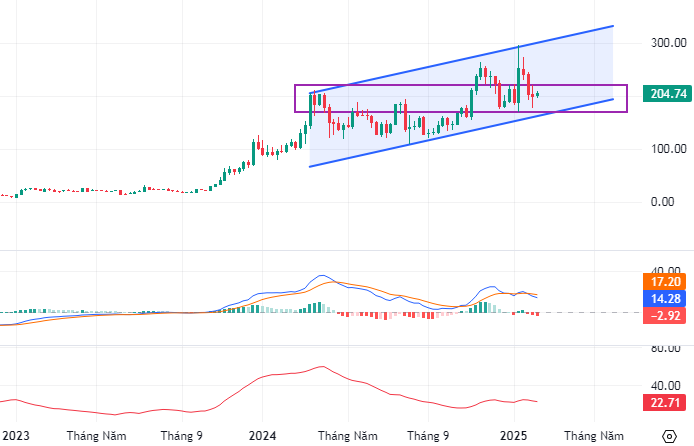
SOL chart for 2023 – 2025 – Source: TradingView
On the daily chart, SOL is retesting the group of 50-day SMA and 100-day SMA while the Stochastic Oscillator indicator gives a buy signal again in the oversold region. If the buy signal is maintained and SOL breaks above these resistance levels, a recovery scenario is likely to unfold in the upcoming sessions.
Based on these signals, investors are advised to refrain from trading at the current price levels and wait for more positive signals before considering re-entering the market.
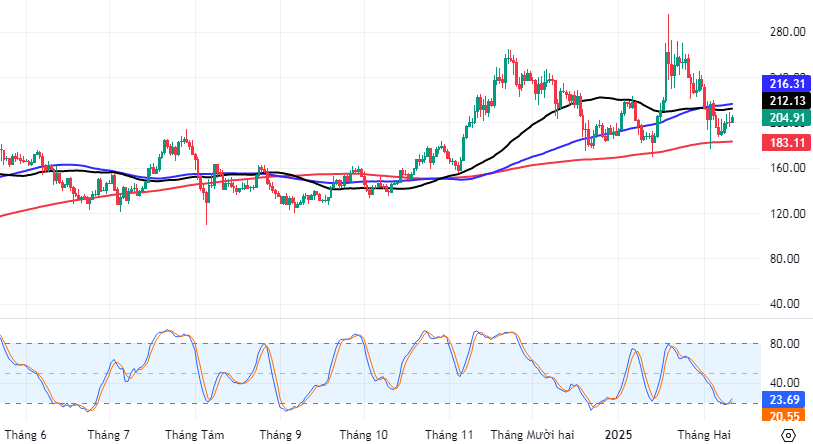
SOL chart for 2024 – 2025 – Source: TradingView
ADA: Awaiting a Bounce
On the daily chart, ADA’s downward momentum suddenly stalled, transitioning into a range-bound phase as it retested its previous high from March 2024 (around $0.68-0.83 USD). The Stochastic Oscillator indicator continues to climb after providing a previous buy signal, suggesting that the sentiment is less bearish.
Additionally, the MACD indicator is gradually narrowing the gap with the Signal line after a previous sell signal. If a buy signal reappears, a recovery could unfold in the upcoming sessions.
Based on these signals, investors should closely monitor the short-term price action and consider investing only when a clear recovery trend emerges.
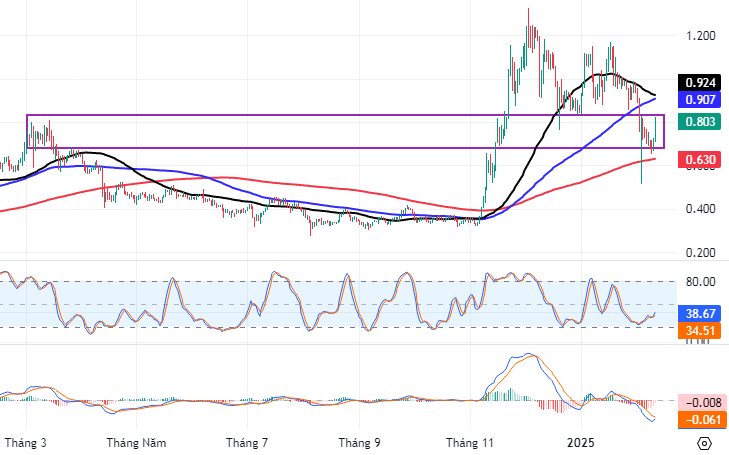
ADA chart for 2024 – 2025 – Source: TradingView
Technical Analysis Team, Advisory Department, Vietstock
– 09:13 21/02/2025
The Ultimate Headline: Short-Term Adjustment Risks Linger

The VN-Index declined with the emergence of a High Wave Candle pattern. The persistent low trading volume, below the 20-day average, indicates cautious trading among investors. Currently, the index is testing the Middle line of the Bollinger Bands. If this level is breached in upcoming sessions, the situation will turn more pessimistic, and a retreat to the old peak breached in June 2024 (1,290-1,310 points) is highly likely. Meanwhile, the Stochastic Oscillator and MACD continue their downward trajectory after issuing sell signals, suggesting that short-term correction risks persist.
The Market Tug-of-War: Vietstock Weekly Analysis 03-07/03/2025

The VN-Index continued its impressive upward trajectory, closely hugging the upper band of the Bollinger Bands. Accompanying this rise was a trading volume above the 20-week average, indicative of strong participation and a healthy flow of capital into the market. However, the index’s persistent volatility last week revealed that the 1,300-point mark is a significant resistance level. For the VN-Index to sustain its bullish momentum, breaking through this threshold in the coming period is essential.
The Art of Contrarian Investing: Navigating Market Swings with a Twist

The VN-Index has been on a rollercoaster ride lately, with alternating up and down sessions. Erratic trading volumes, fluctuating around the 20-day average, reflect investors’ unstable sentiment. However, the MACD and Stochastic Oscillator indicators continue to point upwards, providing a buy signal. If this status quo persists in the upcoming sessions, the short-term outlook may not be as risky as it seems.
“Unleashing the Power of Words: Vietstock Weekly 16-20/12/2024: Navigating Through Hidden Risks”

The VN-Index stalled after three consecutive weeks of gains, with trading volumes remaining below the 20-week average. This reflects a cautious sentiment among investors. Currently, the index sits above the Middle Bollinger Band. If it can sustain this level in the upcoming sessions, the outlook may not be as pessimistic.
The Power of Persuasive Writing: Crafting Compelling Headlines
“The Week Ahead: Uptrend Momentum Sustained”

The VN-Index extended its gains from the previous week, forming a bullish White Marubozu candlestick pattern. This indicates strong buying pressure as the index closed near its high. Additionally, the VN-Index has crossed above the 200-week SMA, reflecting a positive long-term outlook and an increasingly optimistic investor sentiment. However, the MACD indicator is currently showing a sell signal, and a drop below the zero line could trigger a short-term correction. If this occurs, the likelihood of a downward adjustment increases.

 – Short-Term Tug-of-War")


