


: The Short-Term Tug-of-War")


: Navigating the FOMO Trap and ‘Off-Island’ Entries”")


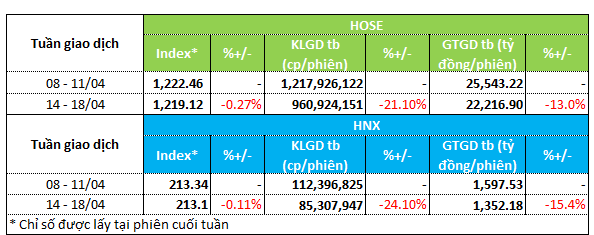
The market witnessed a lackluster week from 14-18/04, with liquidity and points declining across the board. The VN-Index fell by 0.3% to 1,219.12 points, while the HNX-Index dropped by 0.1% to 213.1 points.
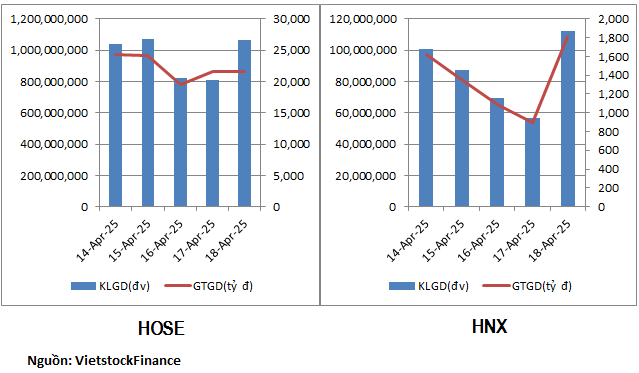
The HOSE floor witnessed a 21% decrease in trading volume to 960 million units per session, while the value of transactions fell by 13% to VND 22.2 trillion. A similar situation occurred on the HNX floor, with trading volume down 24% to 85.3 million units per session and transaction values down 15% to VND 1.3 trillion.
|
Liquidity Overview for the Week of 14-18/04
|
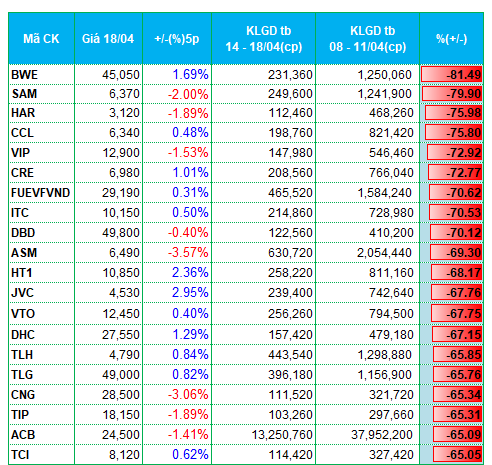
Money was pulled out of the real estate group last week. On both floors, many codes saw trading volumes drop by 60-70% compared to the previous week. HAR, CCL, CRE, ITC, TIP, IDJ, L14, API, NDN, and NRC all fell into the top liquidity losers on both exchanges.
Some securities group stocks saw sharp declines in liquidity of 55-65%. These codes mainly belonged to the mid- and small-cap groups, including TCI, TVC, PSI, and APS.
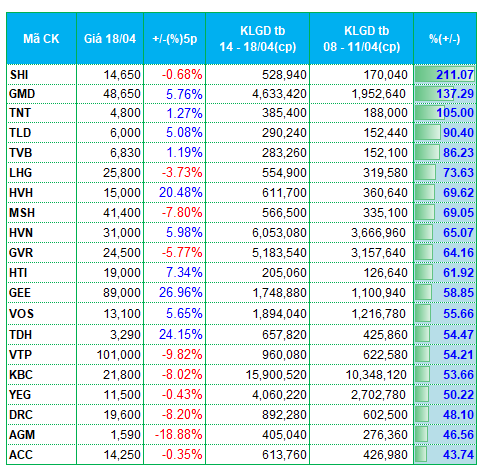
The construction group attracted some money last week. On the upside, HVH, HTI, ACC, and VC2 saw slight increases in liquidity, with trading volumes up 44-70% compared to the previous week. In tandem, some construction material codes, including TNT, TLD, and SVN, entered the liquidity gainers group.
In terms of money inflows, the transportation group saw some codes with increased liquidity. GMD had a positive week, with trading volume up nearly 140% to 4.6 million units per session. The stock price rose nearly 6%. HVN, VOS, and VTP saw volume increases of 50-65%.
|
Top 20 codes with the highest liquidity increase/decrease on the HOSE floor
|
|
Top 20 codes with the highest liquidity increase/decrease on the HNX floor
|
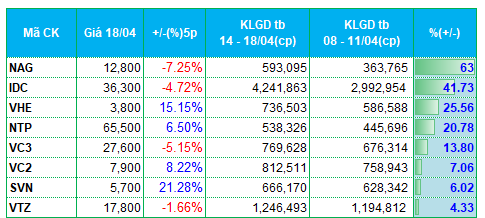
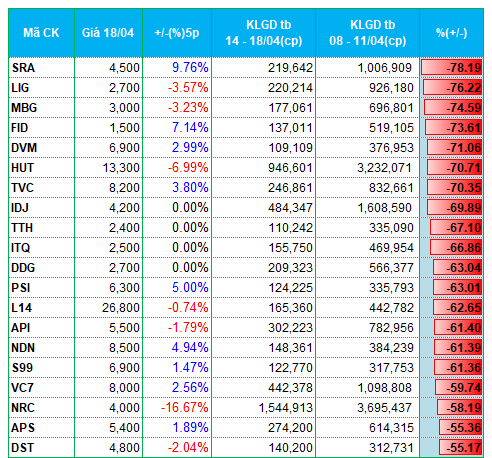
The list of codes with the highest liquidity increase/decrease is based on a trading volume of over 100,000 units/session.
– 19:28 21/04/2025
Market Beat: Running Out of Steam at the Close

The market closed with positive gains, seeing the VN-Index rise by 1.87 points (+0.15%), reaching 1,219.12. Meanwhile, the HNX-Index climbed 3.52 points (+1.68%) to 213.1. The market breadth tilted in favor of bulls, with 571 advancing stocks against 229 declining ones. Within the VN30 basket, bulls dominated, recording 20 gainers, 6 losers, and 4 stocks closing flat.
The Stock Market Week of April 14-18, 2025: Wide-Ranging Sell-Off Pressure

The VN-Index concluded the session with a surprisingly narrowed advance, while the trading volume surpassed the 20-day average. This development underscores the persistent selling pressure that emerged as the index approached the January 2025 resistance zone (equivalent to 1,220-1,235 points). If the VN-Index fails to successfully breach this threshold in the upcoming period, the risk of a correction will become more apparent as profit-taking selling pressure tends to expand.
The Tiring Index

The VN-Index kicked off the week on a strong note, surging by almost 19 points. However, this was short-lived as the market witnessed two consecutive days of sharp declines. Although the index rebounded in the last two sessions, it still ended the week 2 points lower than Monday’s open, closing at 1,219.12.
Technical Analysis for the Session on April 21st: Mixed Signals Start to Emerge

The VN-Index and HNX-Index both witnessed declines, alongside a significant dip in trading liquidity during the morning session. This indicates that investors are exercising caution in their transactions.
The Expert’s View: A Market for the Patient, Not the Impatient.

The second quarter will be a true test of the market’s mettle, according to experts. It is not a time to expect skyrocketing profits but rather to assess businesses’ adaptability and resilience in a potentially volatile environment.


