
The market continued to fluctuate slightly today, and if it weren’t for the ETF restructuring, liquidity would have been low. This is a positive sign as balance and low trading volume indicate a stable phase.
It was predictable that bank stocks would come under pressure and decline today. The remaining variable is how the other large-cap stocks will perform. VIC hit the ceiling yesterday, and VHM also showed strength. But will they continue to gain momentum with ETF demand?
The intraday volatility in the index mainly occurred when VIC and VHM couldn’t make up for the points lost by the banking stocks. For most of the morning, VIC and VHM traded sideways after an initial increase, while the banking stocks plunged. VNI briefly dipped below the reference level but recovered in the afternoon as VIC and VHM gained strength. VNM also showed an interesting dynamic with a quick slide in the latter half of the morning session, only to recover strongly in the ATC with ETF demand. The decline in VNI was also reliably consistent with the large number of stocks that fell simultaneously.
VIC hitting the ceiling and VHM’s 1.8% gain accounted for most of VNI’s increase this session. Positively, many stocks improved their prices. The breadth at the end of the day corresponded with the rising index. Simply put, the large caps created intraday waves, but overall, the stocks reacted similarly. In this scenario, a narrow range and low liquidity are positive signs, indicating a balanced supply and demand.
This is a stable market state, especially since the bottom-fishing volume from the beginning of the week did not result in noticeable selling pressure. By T+3, many stocks at the bottom prices had made good profits, and once again, this advantage was not enough to encourage investors to take profits. The only reason is the expectation of even higher gains or, at least, the confidence to hold on.
The background information remains positive, with no additional tariff shocks and more signs of easing tensions between the US and China. The tariff retaliation spiral has peaked, as have the rhetoric, and things can only cool down from here. Looking back, the market has gone through the most dramatic phases, from the shock of reciprocal taxes to forced liquidation, then stabilization with anxiety as the hotspot reappeared in the response, and now we are seeing soothing efforts.
In fact, domestic factors are quite positive, with stable first-quarter business results and positive messages from the annual general meetings. It’s just that the market has been too focused on external information to ignore internal factors. So, when the external factors fade, the situation naturally calms down.
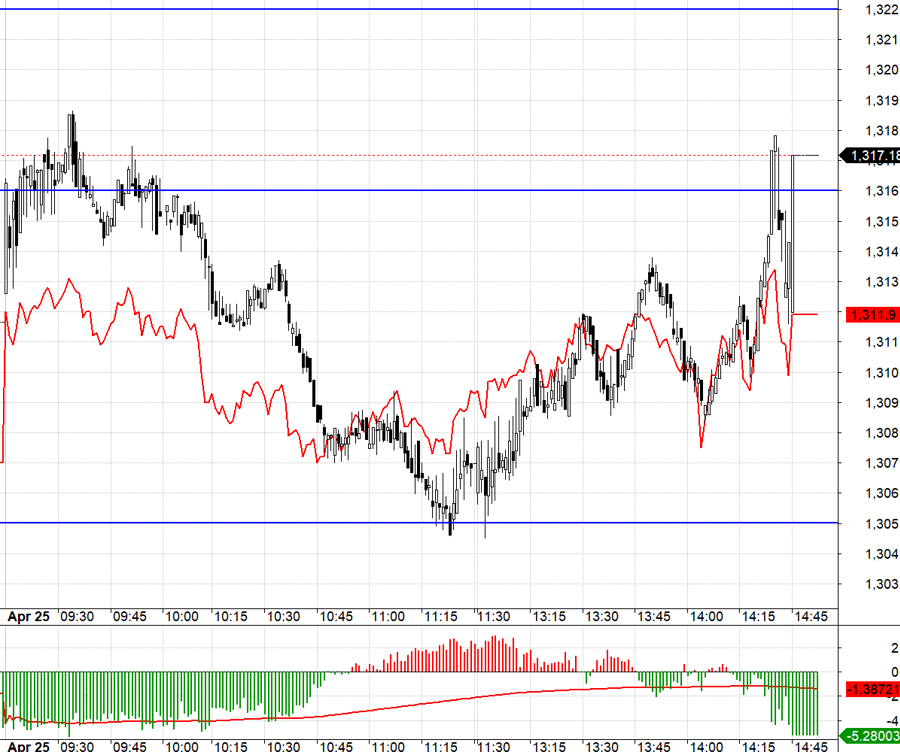
Today, there was a sudden change in supply and demand in the futures market due to the restructuring of ETFs tracking the VN30 index. This mainly affected the futures contracts. F1 accepted a discount of over 3 points at the beginning of the session as a precaution for the scenario where bank stocks – a group with a very large weight in VN30 – were affected. After a few minutes of fluctuating around 1316.xx, the index started to fall along with the bank stocks. F1’s basis reached over 4 points at one point, indicating the emergence of short-selling pressure. However, the expected range from 1316.xx to 1305.xx was quite wide, allowing for short-selling opportunities. The variable to watch is whether stocks like VIC and VHM will change significantly.
VN30 adjusted to exactly 1305.xx just before the break, and a few minutes earlier, F1’s basis reversed. This was an early short-covering signal, and positions could be closed. On the upside, the variable is whether VIC and VHM can pull against the banking stocks. It can be seen that the VN30’s upward movement was not as clear as the downward movement in the morning because the other large caps faced difficulties. Eventually, the index was pushed back to the 1316.xx area, but the futures contracts widened the discount, and the long position’s efficiency was not good.
The narrow range fluctuations in the spot market may continue into the next session, with liquidity likely to decline further. This development is not negative; it just means fewer short-term opportunities. The market needs a strong enough catalyst to end this state, regardless of the direction. Therefore, the strategy remains to hold stocks, take advantage of long/short opportunities with futures contracts, and pay attention to the basis. If the basis is too detrimental, it is possible to stay on the sidelines.
VN30 closed at 1317.18. The nearest resistance levels for the next session are 1324, 1331, 1340, 1347, 1351, and 1358. Support levels are 1306, 1298, 1293, 1286, 1280, and 1271.
“Blog Securities” is a personal column and does not represent the opinion of VnEconomy. The views and opinions expressed are those of the individual investor, and VnEconomy respects the author’s style and perspective. VnEconomy and the author are not responsible for any issues arising from the investment opinions and perspectives presented.
What Was F88’s Business Model Before Going Public?

“F88, a familiar name in the industry, has officially become a public company and is preparing for its UPCoM listing. This significant move has sparked questions among investors and market observers alike: Is F88 truly ready for the stock market? With its transition into the public eye, F88 enters a new phase, inviting scrutiny and high expectations.”
“Stocks Slide as Selling Pressure Weakens, Blue-chips Rebound Ahead of Derivatives Expiry”

The market witnessed a positive shift in the afternoon session as selling pressure eased. Prices gradually climbed, especially after 2:15 pm when the VN30-Index calculations started influencing the final settlement prices. A steady ascent of blue-chip stocks propelled the VN-Index and VN30-Index to surpass the reference levels and close at their highest points for the day.
The Great Squeeze: How the Markets are Forcing a Massive Sell-Off

A fierce sell-off gripped the market this afternoon, sending the VNI plummeting by 5.81% – reminiscent of the panic-stricken sessions triggered by countervailing tax fears. This sudden dip presents an excellent opportunity for savvy investors with a keen eye for market dynamics.
The KRX is Coming: Foreign Investors Snap Up almost VND 600 Billion in Net Purchases

Foreign investors unexpectedly snapped up a substantial net buy of VND 458.2 billion, with a remarkable VND 583.2 billion in matched orders alone.
The Cautious Sentiment Returns

The VN-Index witnessed a significant decline, with trading volume dipping below the 20-day average, reflecting investors’ extremely cautious sentiment. The index is currently retesting the old peak from November 2024 (1,195-1,215 points), which also coincides with the bottom established at the beginning of 2025. If the index sustains these levels, the outlook remains relatively optimistic. Additionally, the MACD indicator is poised to generate a buy signal as the gap with the signal line narrows. Confirmation of this buy signal would alleviate short-term downside risks.


