
In the coming sessions, the VN-Index needs to surpass this threshold to continue its upward trajectory. Currently, the MACD indicator is still giving a buy signal after crossing above the Signal Line. If this indicator crosses above the 0 mark in the near future, the short-term outlook remains optimistic.
I. MARKET ANALYSIS OF STOCK EXCHANGE ON APRIL 28, 2025
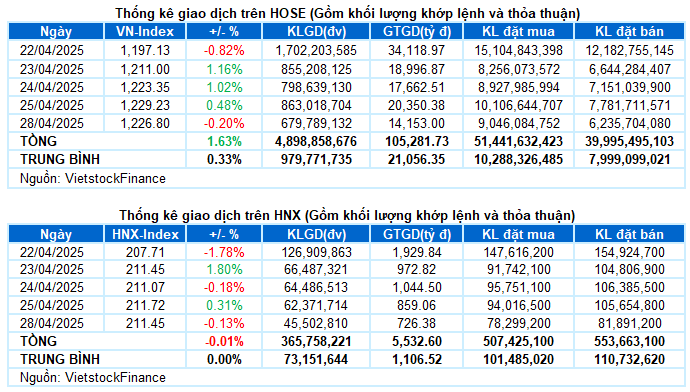
– The main indices slightly decreased during the trading session on April 28. VN-Index decreased by 0.2%, reaching 1,226.83 points, while HNX-Index ended just below the reference mark, attaining 211.64 points.
– Liquidity continued to weaken compared to the lows of the previous week. The matched order volume on HOSE reached over 576 million units, a 27% decrease. The HNX floor recorded over 41 million traded shares, a 28% decrease compared to the previous session.
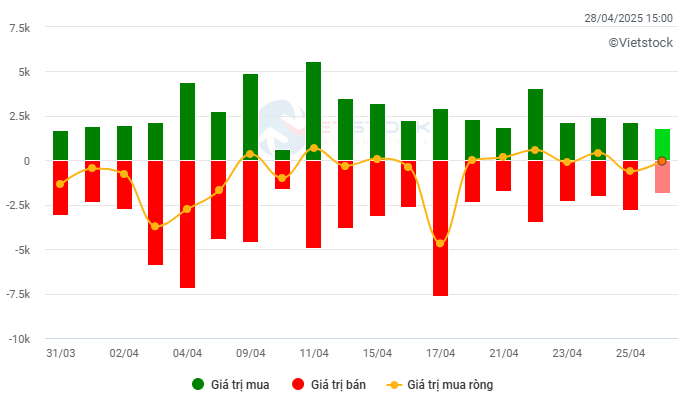
– Foreign investors net sold slightly less than VND 13 billion on the HOSE floor while net bought back about VND 20 billion on the HNX floor.
Trading value of foreign investors on HOSE, HNX and UPCOM by day. Unit: Billion VND
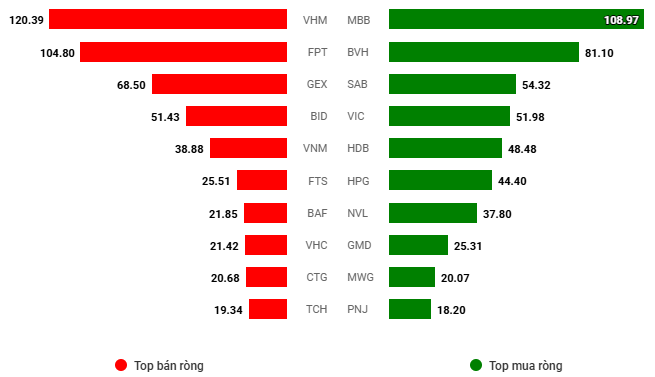
Net trading value by stock code. Unit: Billion VND
– The differentiated performance continued to dominate the market with a noticeable decline in liquidity. Although the VN-Index traded below the reference mark for most of the time, selling pressure was not too strong, mainly due to short-term profit-taking and reduced trading intensity by investors as the market prepared to enter a long holiday period. Trading was rather cautious with a clear differentiation among sectors and stocks. At the close of April 29, the VN-Index slightly decreased by 2.4 points, closing at 1,226.83 points.
– In terms of impact, VHM exerted the most significant pressure, as this stock alone took away 3.5 points from the VN-Index. Following were FPT and BID, which also caused the index to decrease by nearly 2 points. On the other hand, only VIC and SAB notably contributed to the index’s increase, adding 1.5 points.
– VN30-Index decreased by 0.42% in the first session of the week, falling to 1,311.71 points. The breadth of the basket was relatively balanced with 15 gainers, 13 losers, and 2 unchanged stocks. Apart from VHM plunging by more than 6%, FPT and VJC also faced considerable selling pressure, losing over 2%. Conversely, SAB and SSB led the gainers with an increase of 3.4% and 2.8%, respectively.
Sectors exhibited differentiated performances. On the positive side, the industry group was the most prominent bright spot as numerous stocks broke out strongly, including ACV (+4.42%), CII (+2.73%), VSC (+2.2%), VTP (+2.75%), HBC (+6.78%), NCT (+1.49%), and LGC hitting the ceiling price. Nevertheless, red hues were also evident in several stocks such as VJC, CTD, SGP, VOS, VTO, BCG, HHV, VCG, and so forth.
Conversely, the information technology group lost nearly 2.5% due to pressure mainly from FPT, the stock with the largest capitalization in the sector, which decreased by 2.58%. The real estate group also decreased by over 1% as red hues spanned across VHM (-6.1%), KDH (-1.84%), KBC (-1.32%), DXG (-2.01%), IDC (-1.89%), TCH (-3.4%), NLG (-1.61%), VPI (-2.04%), and SZC (-1.33%). Despite this, several stocks moved against the trend with notable liquidity, including VIC (+1.49%), VRE (+1.32%), NVL (+5.53%), HQC (+1.37%), and SIP (+1.46%).
The slight decrease in the VN-Index coupled with trading volume remaining below the 20-day average indicates investors’ cautious sentiment. Currently, the latest peak formed in mid-April 2025 (corresponding to 1,230 – 1,245 points) is acting as a short-term resistance level for the index. In the upcoming sessions, the VN-Index needs to surpass this threshold to continue its upward trajectory. At present, the MACD indicator is still giving a buy signal after crossing above the Signal Line. If this indicator crosses above the 0 mark in the future, the short-term outlook remains optimistic.
II. TREND AND PRICE MOVEMENT ANALYSIS
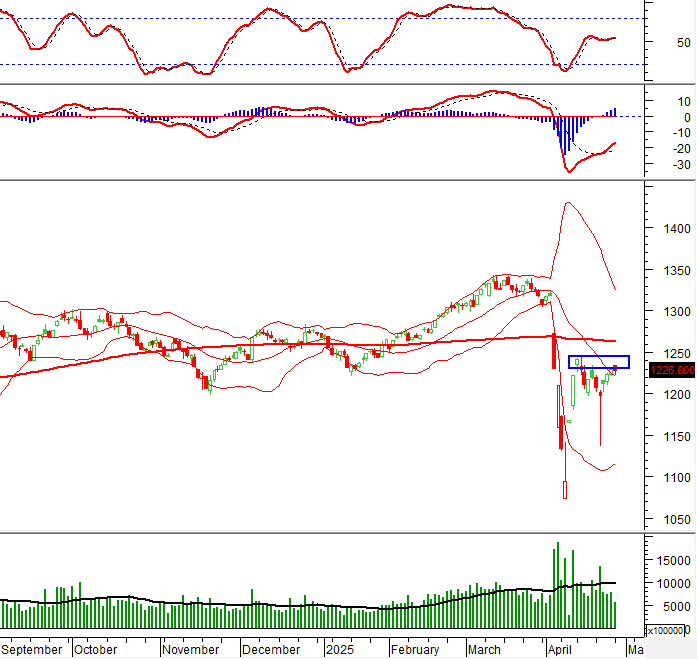
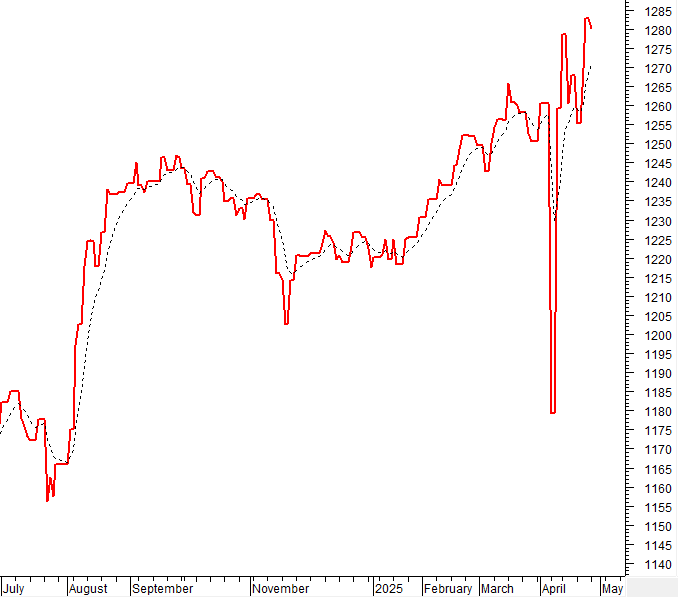
VN-Index – The peak region of April 2025 is acting as a short-term resistance level
The slight decrease in the VN-Index, along with trading volume remaining below the 20-day average, indicates investors’ cautious sentiment. Currently, the latest peak formed in mid-April 2025 (corresponding to 1,230 – 1,245 points) is acting as a short-term resistance level for the index. In the upcoming sessions, the VN-Index needs to surpass this threshold to sustain its upward trend.
At present, the MACD indicator continues to give a buy signal after crossing above the Signal Line. If this indicator crosses above the 0 mark in the future, the short-term outlook will remain optimistic.
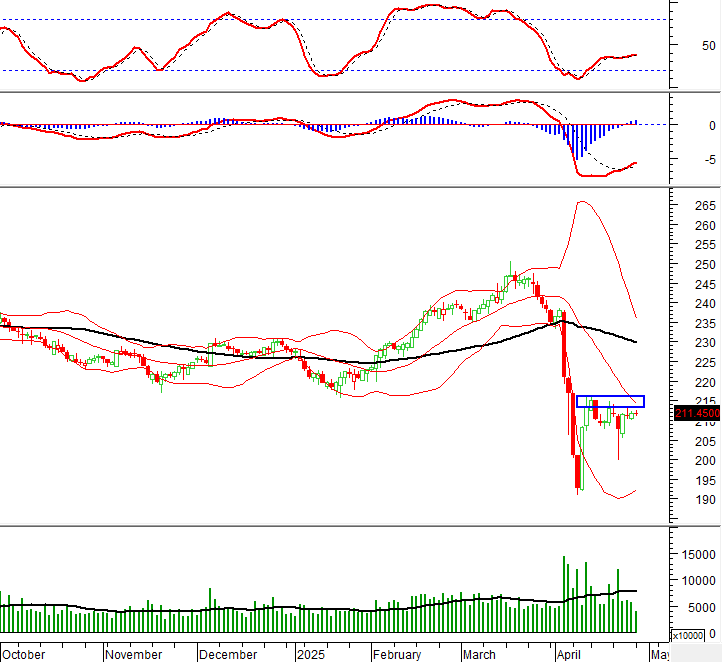
HNX-Index – Trading volume remains low
The HNX-Index returned to a decrease while continuously forming alternating rising and falling sessions recently. Additionally, trading volume dropped below the 20-day average, reflecting investors’ increasing caution.
Presently, the index has broken through the old bottom formed in October 2023 (corresponding to the 204-208 point region) and is heading towards the next resistance region formed in mid-April 2025 (corresponding to the 213-216 point region). For the HNX-Index to maintain its upward trajectory in the future, it needs to break through this region with an improvement in liquidity.
Money Flow Analysis
Fluctuation of smart money flow: The Negative Volume Index indicator of the VN-Index crossed above the EMA 20 day line. If this status continues in the next session, the risk of an unexpected downturn (thrust down) will be limited.
Fluctuation of foreign capital flow: Foreign investors net bought in the trading session on April 28, 2025. If foreign investors maintain this action in the coming sessions, the situation will be less pessimistic.
III. MARKET STATISTICS ON APRIL 28, 2025
Economic and Market Strategy Analysis Department, Vietstock Consulting and Research
– 17:09 28/04/2025
Market Beat: Afternoon Session Divergence, VN-Index Curbs Gains

The widening divergence in the afternoon session erased most of the morning’s gains. At the close, the VN-Index pared its intraday gains, rising just 2 points to 1,241.95. The HNX-Index edged up 0.08 points to 212.89.
Market Beat: VN-Index Recovers from 70-Point Loss to Close Down Just Under 10 Points

The market seemed poised for a major correction at the start of the afternoon session, but buyers quickly stepped in as the index touched the strong support level of 1,140 points. This swift response from buyers fueled a continuous recovery for the remainder of the trading day.
Stock Market Update for April 28-29, 2025: The Tug-of-War Continues

The VN-Index ended the week with a slight decline, maintaining a tug-of-war stance as alternating weeks of gains and losses have been prevalent in recent times. This reflects the unstable sentiment of investors following the sharp decline at the end of March 2025. At present, the index is struggling to surpass the crucial resistance level at the 200-week SMA. If this condition persists, the prospect of the VN-Index establishing an upward trend in the coming period will face further challenges.
The Market Wrap: VN-Index trims losses thanks to late buying spree

The unexpected surge in buying pressure towards the end of the session helped VN-Index trim its losses significantly, thus successfully defending the old support base established in November 2024 (corresponding to the 1,195-1,215 point range). If the VN-Index continues to hold this fort, the market outlook will be less negative and a recovery rally is expected in the coming period. Moreover, the MACD indicator is poised to generate a buy signal again as the gap with the Signal Line narrows. Should this buy signal be confirmed, the risk of short-term corrections will be mitigated.
The Market Mind: Caution Still Lingers

The VN-Index pared its gains, forming an Inverted Hammer candlestick pattern and failing to breach the previous peak established in mid-April 2025 (1,230-1,245 points). The cautious sentiment among investors was further reflected in the trading volume, which remained below the 20-day average. To sustain its upward trajectory, the index needs to surpass this threshold in the upcoming sessions. Nonetheless, the MACD and Stochastic Oscillator indicators remain upward-pointing and have generated buy signals. If this status quo persists, the short-term optimistic outlook is likely to extend.


