
BTC: Sustaining the Mid to Long-Term Outlook
On the weekly chart, BTC surged after retesting the 50-day SMA and the November 2024 high (around $68,500-$77,500), indicating a positive mid-term outlook.
Additionally, BTC consistently formed higher highs and higher lows, with the Stochastic Oscillator trending upwards and previously giving a buy signal, confirming the establishment of a long-term uptrend.

BTC’s 2023 – 2025 Weekly Chart – Source: TradingView
On the daily chart, the April 2025 low (approximately $73,000-$77,000) is acting as a strong support area for BTC going forward.
Currently, the price is retesting the 78.6% Fibonacci Projection level (around $92,500-$97,500) as the MACD shows a sell signal again. If this signal improves, the short-term optimistic outlook may continue in the upcoming sessions.
Based on these signals, we anticipate BTC to experience some volatility at the aforementioned Fibonacci Projection level before entering a clearer trend.
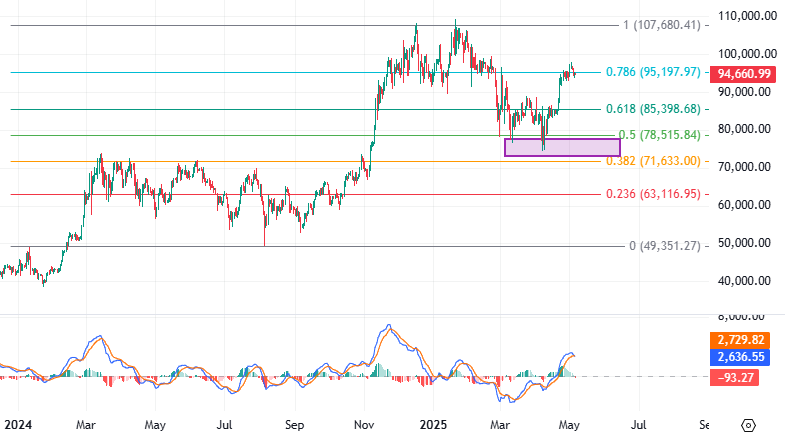
BTC’s 2024 – 2025 Daily Chart – Source: TradingView
ETH: Potential Recovery Scenario
On the weekly chart, ETH found support at the October 2024 low (approximately $1,500-$2,000), suggesting that the bearish sentiment has eased.
Currently, the price is retesting the 23.6% Fibonacci Retracement level, with the MACD narrowing the gap with the signal line after previously giving a sell signal. If a buy signal reappears, a recovery scenario is likely to unfold in the upcoming period.
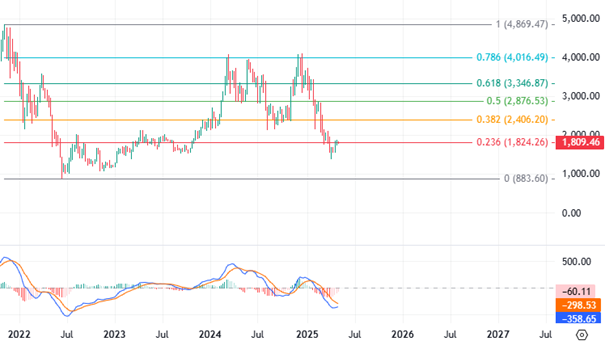
ETH’s 2022 – 2025 Weekly Chart – Source: TradingView
Switching back to the daily chart, ETH is approaching the upper bound of the short-term descending price channel amid a weakening ADX, suggesting a period of consolidation with interspersed bullish and bearish sessions.
However, the Bollinger Bands are narrowing (Bollinger Squeeze), and the MACD maintains its previous buy signal. If a breakout occurs, ETH’s price is likely to follow the upper band and successfully breakout above the aforementioned channel’s upper bound, initiating a recovery phase.
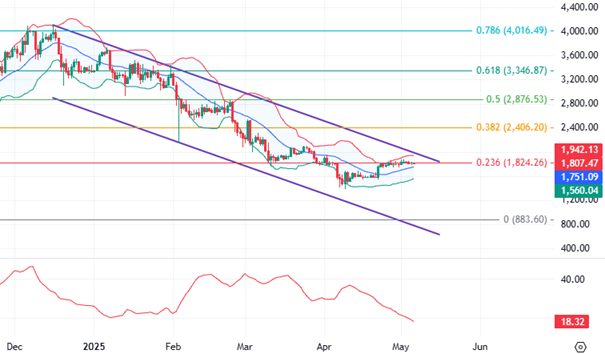
ETH’s 2024 – 2025 Daily Chart – Source: TradingView
Vietstock Technical Analysis Team
– 09:40 12/05/2025
Stock Market Insights: VN-Index Rebounds but Short-Term Risks Linger

The VN-Index concluded the week with a substantial surge of 41 points, successfully breaching the 200-week SMA since the index plummeted below this critical level in early April 2025. Accompanying this impressive recovery was a trading volume that surpassed the 20-day average, indicating a positive shift in market participation. Nonetheless, the MACD indicator continues to flash a sell signal, lingering below zero. This suggests that risks remain latent in the market. Investors are advised to exercise caution in the coming period should this trend persist.
Tightening the Reins on Virtual and Crypto Assets

The inclusion of specific concepts and classifications of virtual assets, encrypted assets, and cryptocurrencies, along with regulations governing the provision of related services, is essential for safeguarding consumer interests and combating fraud, scams, money laundering, and terrorist financing.
“Forewarned is Forearmed: The Bitter Lesson From a Coin Guru’s Account Disaster”

The cryptocurrency trading market, despite lacking legal protection in Vietnam, remains a tantalizing arena that offers the allure of substantial financial gains. The very nature of this market presents opportunities for individuals to exponentially multiply their investments. However, it is imperative to remember that higher profits invariably come hand-in-hand with significantly elevated risks, as exemplified by the recent account-draining experience of Manh, a novice coin enthusiast.
Technical Analysis for May 9: Market Sentiment Turns Cautious

The VN-Index and HNX-Index both witnessed a decline in points, and with no significant improvement in liquidity during the morning session, it indicates that investors are exercising caution in their trading activities.
The Golden Crash: When World Gold Prices Plummet and Bitcoin, Stocks Soar.

The gold price took a significant dip following US President Donald Trump’s announcement of a trade deal with the UK, sparking hopes of similar breakthroughs with other nations. Global stock markets, cryptocurrencies, and oil prices rebounded, indicating a shift towards a more positive investor sentiment.

 – Short-Term Tug-of-War")


