
I. MARKET ANALYSIS OF SECURITIES ON MAY 29, 2025
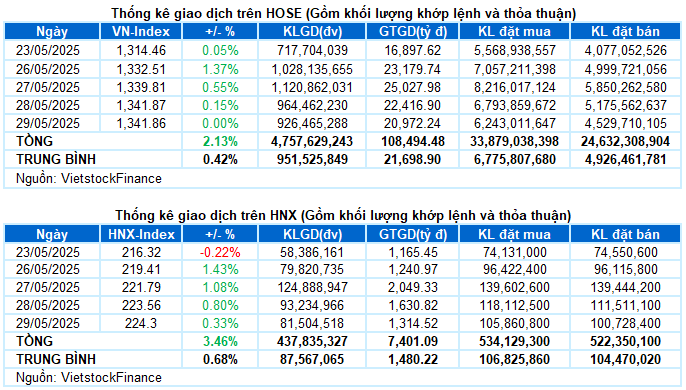
– As of the close of the May 29 session, the VN-Index ended just below the reference mark, reaching 1,341.86 points. Meanwhile, the HNX-Index rose slightly by 0.33%, to 224.3 points.
– The matched order volume on the HOSE floor was comparable to the previous session, reaching nearly 895 million units. Meanwhile, the HNX floor recorded a volume decline of nearly 13%, reaching over 81 million units.
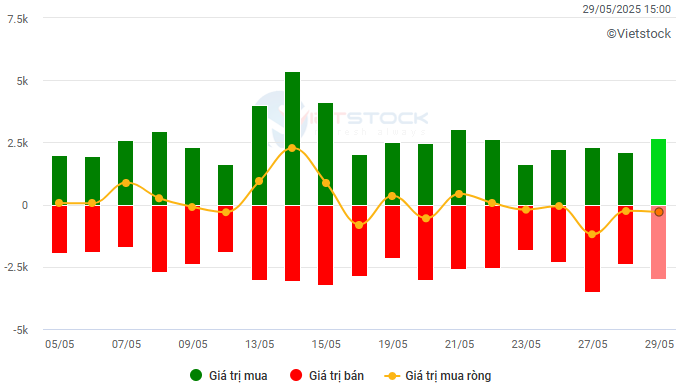
– Foreign investors net sold with a value of nearly VND 260 billion on the HOSE and over VND 4 billion on the HNX.
Trading value of foreign investors on HOSE, HNX and UPCOM by day. Unit: VND billion
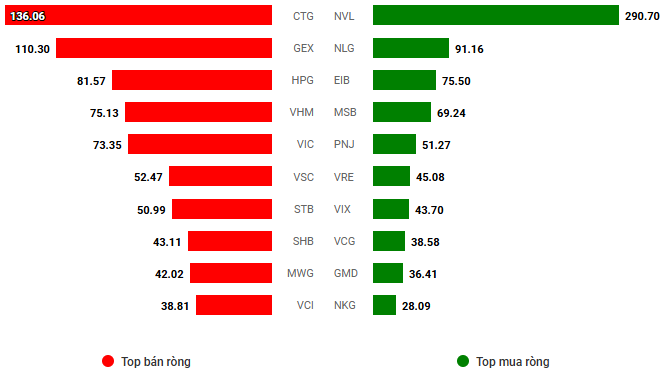
Net trading value by stock code. Unit: VND billion
– The strong volatility continued in the May 29 session. Responding to the positivity from international markets, the VN-Index rose to near the 1,350-point threshold right after the opening bell. However, profit-taking pressure quickly increased, causing the index to fluctuate and lose its upward momentum in the morning session. The afternoon session witnessed a significant recovery thanks to the positive effect from the real estate group. Nevertheless, stronger selling pressure toward the end of the session pushed the index into the red. The VN-Index closed just below the reference level, at 1,341.86 points.
– In terms of impact, VHM was the leading stock on the positive side, helping the VN-Index gain more than 1 point. This was followed by EIB, VRE, TCB, and NVL, with fairly equal contributions, each bringing about half a point to the index. On the other hand, CTG and FPT were the two most notable stocks on the losing side, taking away more than 1 point from the VN-Index.
– The VN30-Index edged down 0.04%, to 1,431.57 points. Breadth was negative with 21 declining stocks, 8 advancing stocks, and 1 stock closing unchanged. Notable stocks falling over 1% included PLX, CTG, BVH, SHB, SSB, and FPT. Meanwhile, VRE stood out with a nearly 4% gain, followed by VHM, BCM, and TCB, which also recorded gains of over 1%.
More than half of the sector groups ended in negative territory. The energy, industry, and information technology groups faced selling pressure, falling over 1%, mainly due to the weakness of large-cap stocks such as BSR (-1.93%), PVS (-1.72%), PVD (-1.57%); ACV (-3.18%), HVN (-1.39%), PHP (-2.05%), VSC (-6.99%); FPT (-1.1%) and CMG (-0.58%).
On the contrary, real estate continued to be the market’s bright spot, attracting strong buying interest across the board. A series of stocks made impressive breakthroughs, such as NVL and NTL hitting the ceiling price, VRE (+3.56%), VHM (+1.59%), NLG (+3.65%), IDC (+2.09%), SIP (+3.65%), TCH (+2.82%), DIG (+2.18%), CEO (+5.41%), HDC (+6.67%),…
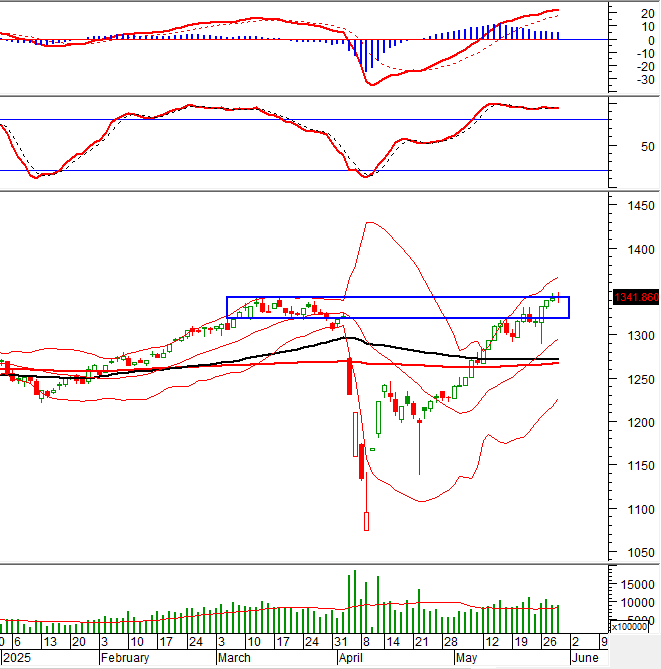
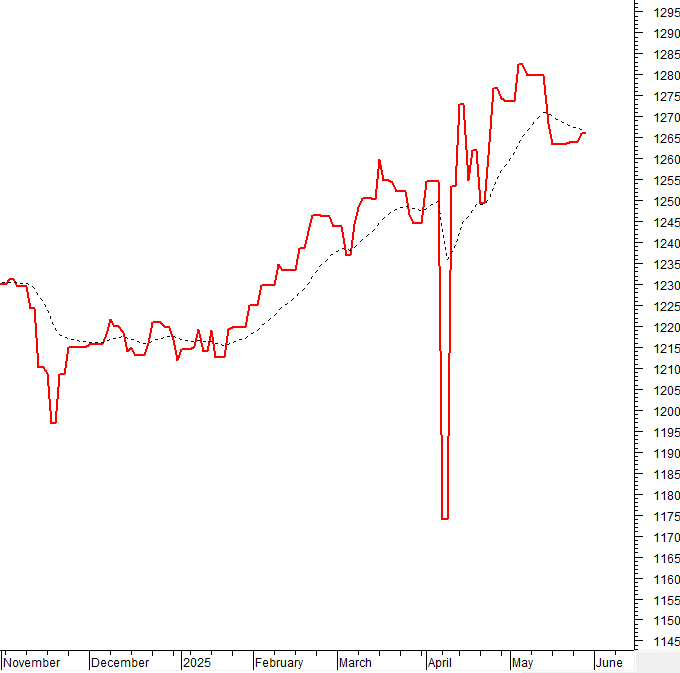
The VN-Index narrowed its loss after a prolonged volatile session, forming a Doji candlestick pattern. This indicates the presence of investor indecision. Currently, the index is still holding above the old peak of March 2025 (corresponding to the 1,320-1,340 range), so the situation is not too pessimistic. However, the Stochastic Oscillator indicator is moving deep into overbought territory. Investors should be cautious if the indicator falls out of this zone.
II. TREND AND PRICE MOVEMENT ANALYSIS
VN-Index – Doji Candlestick Pattern Emerges
The VN-Index narrowed its loss after a prolonged volatile session, forming a Doji candlestick pattern. This indicates investors’ indecision. Currently, the index remains above the old peak of March 2025 (around 1,320-1,340 points), so the situation is not overly pessimistic.
However, the Stochastic Oscillator indicator is venturing deep into overbought territory. Investors should exercise caution if the indicator falls out of this zone.
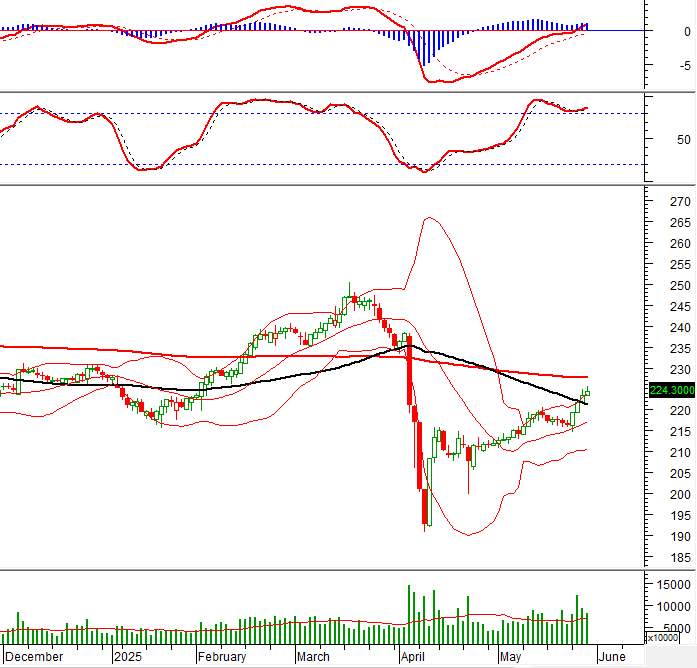
HNX-Index – MACD Indicator Crosses Above the Zero Line
The HNX-Index continued its upward momentum while closely following the Upper Band of the Bollinger Bands. If, in the coming sessions, the index surpasses the SMA 100-day moving average, the outlook will become even more positive.
At present, the MACD indicator maintains a buy signal since crossing above the zero line. This suggests that the short-term optimistic outlook remains intact.
Money Flow Analysis
Movement of smart money: The Negative Volume Index indicator of the VN-Index fell below the EMA 20-day moving average. If this status continues in the next session, the risk of an unexpected downturn (thrust down) will increase.
Foreign capital flow: Foreign investors continued to net sell in the trading session of May 29, 2025. If foreign investors maintain this action in the coming sessions, the situation will turn more pessimistic.
III. MARKET STATISTICS ON MAY 29, 2025
Economic and Market Strategy Division, Vietstock Consulting Department
– 16:47 29/05/2025
Market Beat: VN-Index Retreats, Real Estate Stages a Slight Uptick

The market closed with declines for the major indices; the VN-Index fell by 9.26 points (-0.69%), settling at 1,332.6, while the HNX-Index dropped 1.08 points (-0.48%) to 223.22. The market breadth tilted towards decliners, with 497 stocks closing in the red compared to 285 gainers. This bearish sentiment was echoed in the VN30 basket, where 25 stocks declined, four advanced, and one remained unchanged.
Stock Market Wrap-up for Week of May 26-30, 2025: A Pause in the Rally

The VN-Index stalled its upward trajectory following a significant dip last week. The index retreated to test the old peak from March 2025 (1,320-1,340 points). Meanwhile, persistent net selling by foreign investors continues to weigh on the market. If this trend persists, the short-term outlook may face challenges, indicating potential hurdles for a smooth correction.
The Overseas and Proprietary Desks Liquidate Together, While Retail Investors Keep the Race Going.

Today’s trading liquidity across the three exchanges reached nearly 23 trillion dong. Foreign investors sold a net 304.6 billion dong, with a net sell of 341.4 billion dong in matched orders alone.
The Hot Stock Divide: VN-Index’s “Quirky” Rise

The mounting pressure on blue-chip stocks dragged the VN-Index down for most of today’s afternoon session. It would have dipped further than 0.01 points if it weren’t for the sudden boost to VHM in the final trading phase. A divergence is emerging, with sell-offs in previously hot stocks while others are being aggressively pushed up.
Market Pulse May 29: Real Estate Rides to the Rescue as Large-Cap Stocks Take a Tumble

The VN-Index ended the session on May 29 down 0.01 points to 1,341.86, while the HNX-Index and UPCoM-Index posted gains, rising 0.74 points to 224.3 and 0.03 points to 98.62, respectively. The real estate sector was the main driver, with Large Cap stocks facing pressure during the session.


