
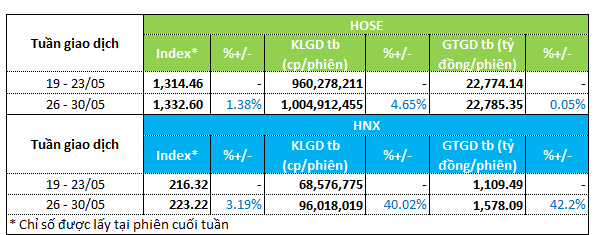
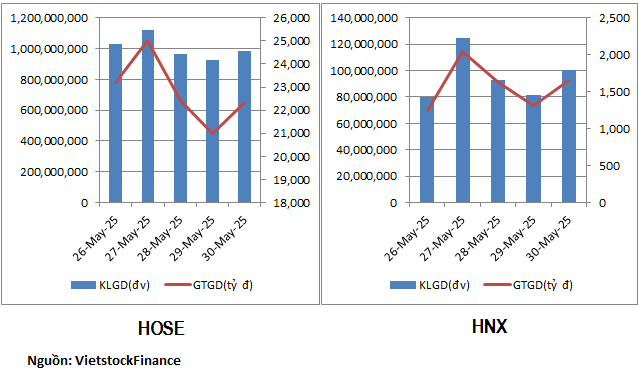
The market rallied in the last week of May (May 26-30), with the VN-Index gaining 1.4% to close at 1,332.6 points. The HNX-Index also rose over 3% to 223.22 points.
Trading liquidity on the HNX floor improved evenly in both volume and value. The average trading volume per session increased by 40% to 96 million units, while the value traded rose by 40% to VND1.5 trillion.
Meanwhile, the HOSE floor saw only a slight increase in liquidity. The average trading volume rose by 4.6% to over 1 billion units per session, while the value traded inched up by just 0.05% to nearly VND22.8 trillion.
|
Market Liquidity Overview for the Week of May 26-30
|
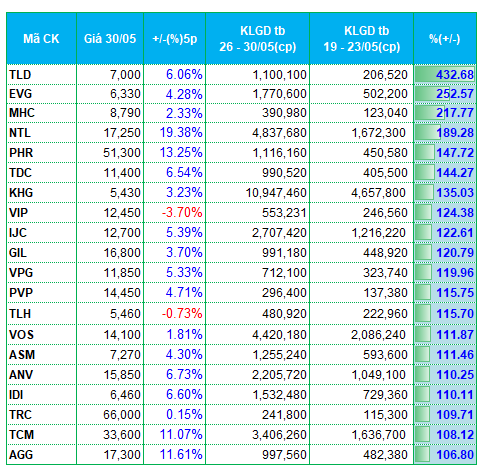
The money-attracting group last week included many stocks in the fields of maritime transportation, seafood, and textiles.
In the maritime transportation sector, MHC, PVP, VOS, and DXP attracted the attention of investors.
On the other hand, stocks in the export sector, including seafood and textiles, were favored by the money flow. ASM, ANV, and IDI from the seafood group, along with GIL, TCM, and TNG from the textile group, were among the stocks with significantly increased trading liquidity on the two exchanges.
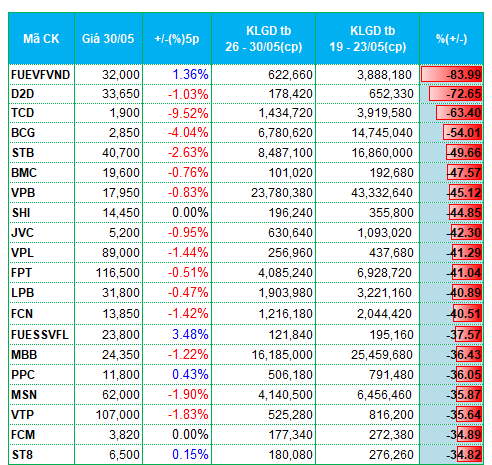
The real estate group showed a mixed performance. Specifically, a series of stocks in the top gainers in liquidity included NTL, TDC, KHG, IJC, AGG, CEO, L14, and AAV. Among them, EVG, CEO, and L14 stood out with liquidity surging over 200% compared to the previous week. In contrast, D2D, API, NRC, IDJ, and VC3 were on the losing side.
The financial and banking group witnessed a slight capital outflow. Bank stocks such as STB, LPB, and MBB, securities stocks like VIG, APS, SHS, and MBS, and fund certificates, including FUEVFVND and FUESSVFL, were among the top losers in liquidity last week.
|
Top 20 Stocks with the Highest Increase/Decrease in Liquidity on the HOSE
|
|
Top 20 Stocks with the Highest Increase/Decrease in Liquidity on the HNX
|
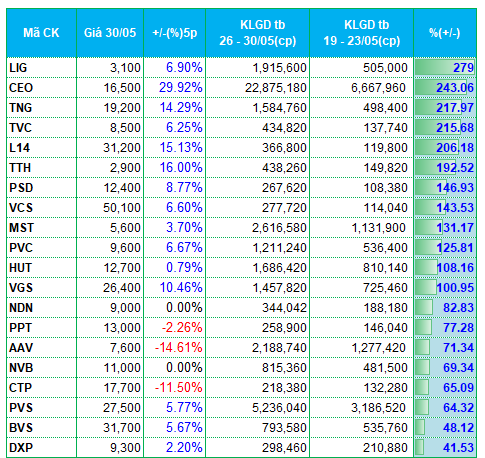
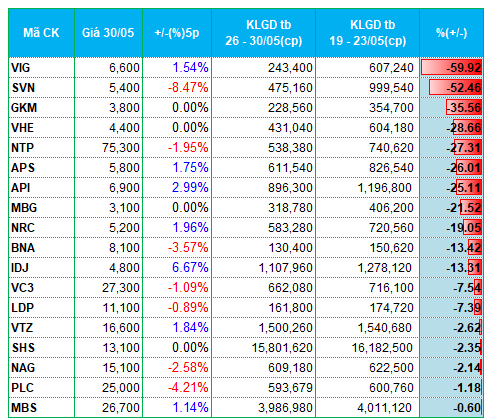
The list of stocks with the highest increase/decrease in liquidity is based on a minimum average trading volume of 100,000 units per session.
– 7:28 PM, June 2, 2025
Resilient Market in May: Who Were the Top Net Sellers?

“Institutional investors were the strongest net sellers in the past month, with a net selling value of up to 4,314.8 billion VND. Notably, they net sold 3,616.4 billion VND through order matching alone.”
Market Pulse June 2nd: Energy Sector Surges, VN-Index Recaptures Green Territory

The trading session concluded with the VN-Index climbing 3.7 points (+0.28%), reaching 1,336.3. Meanwhile, the HNX-Index witnessed a rise of 2.95 points (+1.32%), ending at 226.17. The market breadth tilted towards gainers, as 438 stocks advanced against 323 decliners. Similarly, the VN30 basket saw a slight dominance of greens, with 16 gainers, 13 losers, and 1 stock remaining unchanged.
Market Pulse June 2nd: Blue Chips Dive, VN-Index Down Over 8 Points

The heavy pressure from the pillar group is causing the VN-Index to gradually lose momentum in the late morning session. By the mid-session break, the VN-Index had dropped 0.62%, settling at 1,324.4 points. In contrast, the HNX-Index climbed 0.66% to reach 224.69 points. The market breadth was negative, with 353 declining stocks against 306 gainers.
The Big Dip: Why Large-Cap Stocks are Taking a Tumble, While Small Real Estate Remains Resilient

The market opened the month of June with a steep decline in the VN30-Index, erasing 0.99% as large-cap stocks faced downward pressure. The VN-Index also took a hit, falling 0.62% due to losses in VIC and VHM. However, money continued to flow into mid-cap stocks, indicating a cautious but persistent appetite for opportunities in the market.
Technical Analysis for June 2nd: A Market Torn Between Emotions

The VN-Index and HNX-Index exhibited a contrasting performance in the morning session, with a mix of positive and negative technical signals. This indicates a continued tug-of-war between bulls and bears, reflecting the investors’ uncertain sentiment.


