
Technical Signals for VN-Index
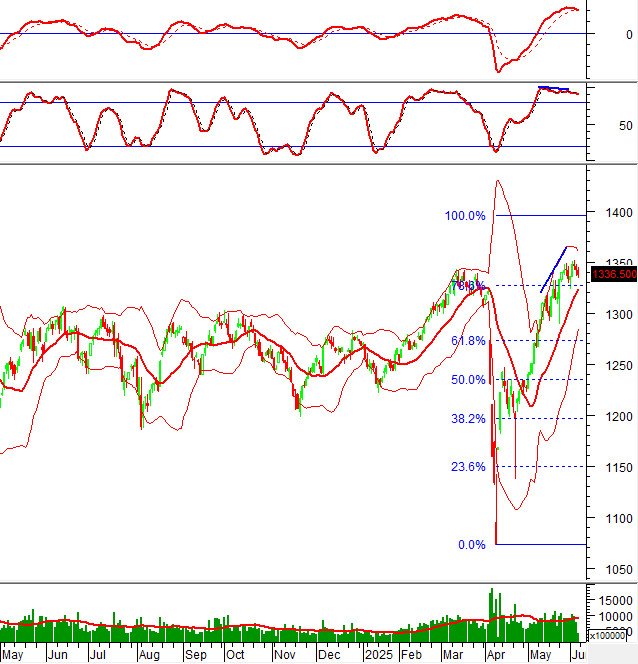
During the trading session on the morning of June 6, 2025, the VN-Index witnessed a decline and formed a Three Black Candles pattern, accompanied by a slight increase in volume. This reflects a rather pessimistic sentiment among investors.
Additionally, the index is approaching the 78.6% Fibonacci Projection level (equivalent to the 1,310-1,335 point region) while the MACD indicator has triggered a sell signal again. If the short-term outlook remains bleak, this area could serve as a strong support level for the VN-Index in the upcoming sessions.
Technical Signals for HNX-Index
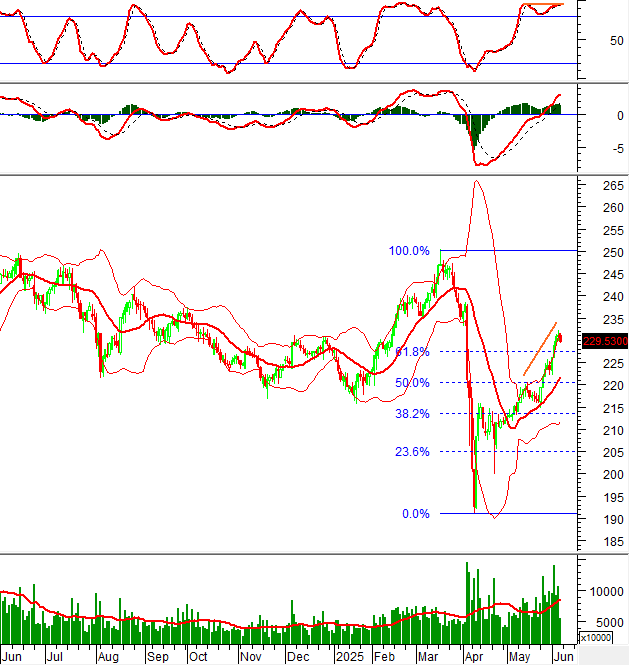
On June 6, 2025, the HNX-Index witnessed a decline in the trading session, along with a volume that is expected to surpass the 20-day average by the end of the day, indicating a pessimistic sentiment among investors.
Furthermore, the index is positioned above the 61.8% Fibonacci Retracement level (equivalent to the 226-229 point region) while the Stochastic Oscillator indicator is forming a bearish divergence. If the indicator triggers a sell signal again in the upcoming sessions and the index undergoes a short-term correction, this region could act as a solid support level for the HNX-Index.
HAG – Hoang Anh Gia Lai Joint Stock Company
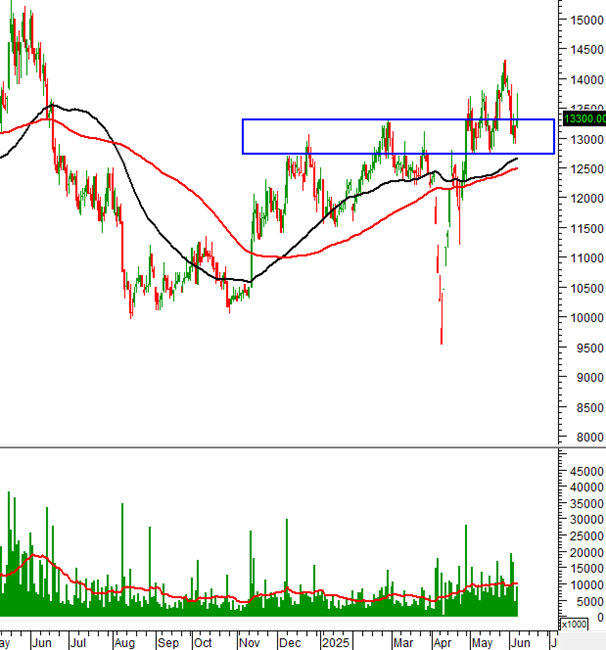
The HAG stock price experienced intense fluctuations and formed an Inverted Hammer pattern during the morning session on June 6, 2025. The trading volume surged significantly, approaching the 20-day average within the morning session itself, signifying a return of capital inflows into this stock.
The price is currently above the long-term MA group, and the 12,700-13,200 range is expected to act as a support level in the coming period.
HPG – Hoa Phat Group Joint Stock Company
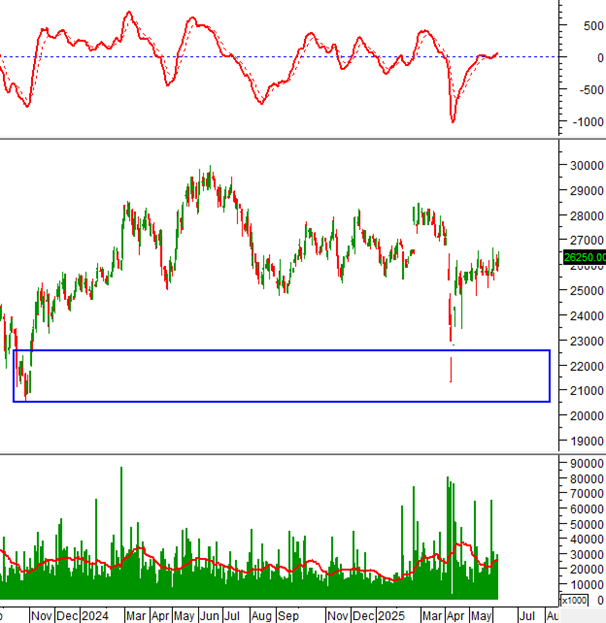
During the morning trading session on June 6, 2025, the HPG stock price witnessed a strong surge, accompanied by a volume surpassing the 20-day average. The MACD indicator has triggered a buy signal again and completely breached the zero level.
HPG’s short-term objective is the 27,500-28,500 range, which corresponds to the previous peak in February 2025.
Technical Analysis Department, Vietstock Consulting
– 12:09 06/06/2025
Market Tug-of-War: The Ongoing Battle Unveiled

The VN-Index witnessed a slight dip with a tug-of-war session, coupled with below-average trading volume. A throwback is currently unfolding as the VN-Index has recently breached a strong resistance level of 1,320-1,340 points. Notably, the MACD indicator has been narrowing its gap with the Signal line in recent sessions. Should this indicator flash a sell signal in the upcoming periods, the risk of a short-term correction may emerge.
“VNDirect’s CEO Addresses Share Price Concerns: Hold On, No Loss Yet, We Ask Shareholders to Stay Patient with Us.”

“Market share is something every company desires, but for VNDirect, it’s not the be-all and end-all,” says Chairwoman Pham Minh Huong.
Is the Mid and Small-Cap Stock Group Undervalued?

The notable observation here is that the P/E ratio of the Non-Financial sector, excluding Real Estate, has plummeted by a staggering -35% from its peak a year ago, which also marked a historical high for this group. This represents a significantly deeper discount compared to the broader market, with the overall market’s P/E declining by -14%, Banks by -10%, and Real Estate by -28%.
Technical Analysis for May 27: Mixed Signals Emerge

The VN-Index and HNX-Index both climbed in the morning session, but technical indicators painted a mixed picture, suggesting that investor sentiment is somewhat cautious.
The Market Pulse: Will Profit-Taking Pressure Emerge?

The VN-Index witnessed a negative turn with a significant surge in trading volume above the 20-day average. This indicates profit-taking pressure as the index retests the old peak from March 2025 (around the 1,320-1,340 point range), triggering market jitters. If selling pressure persists in upcoming sessions, the correction risk will escalate. The Stochastic Oscillator, a key indicator, has been in a downward trajectory after signaling a sell-off in the overbought zone. Investors are advised to exercise caution if the indicator falls out of this range in the near term.


