
BTC: Can it Sustain its Uptrend and Break All-Time Highs?
On the weekly chart, BTC maintains its upward momentum after successfully breaking out of a short-term descending channel.
Additionally, the MACD indicator has crossed above the Signal line and is residing above the 0 threshold. The MACD is also moving upwards, widening its gap from the Signal line.
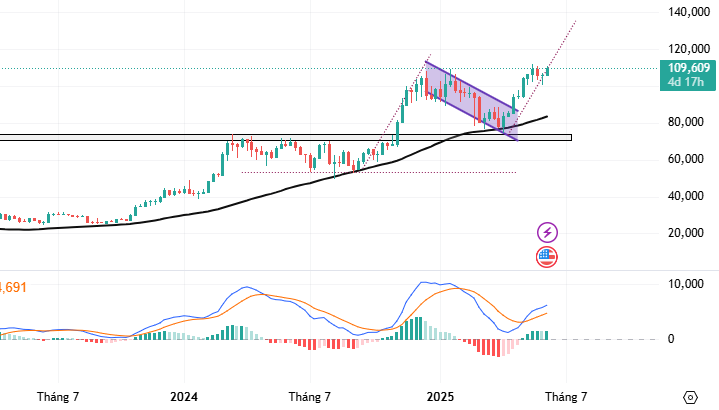
BTC Weekly Chart: 2023 – 2025 – Source: TradingView
On the daily chart, the previous high from May 2025, ranging from 109,000 to 112,000 USD, is acting as a resistance zone. If BTC can surpass this level in the coming sessions, the bullish momentum will be reinforced.
Currently, both the MACD and Stochastic Oscillator indicators are displaying buy signals. If these indicators continue to remain bullish, the short-term optimistic outlook may persist in the upcoming sessions.
Should BTC successfully breach the May 2025 high, the next target would be the 118,000-120,000 USD zone (refer to the image below).
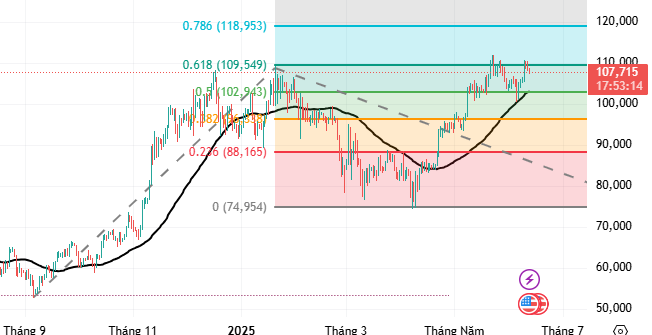
BTC Daily Chart: 2024 – 2025 – Source: TradingView
ETH: Will the Recovery Scenario Persist?
On the weekly chart, ETH continues its recovery after successfully testing the previous low from October 2023, which ranges from 1,500 to 1,600 USD.
Moreover, ETH’s recovery trend is reinforced by the MACD indicator, which is displaying a buy signal and approaching the 0 level.
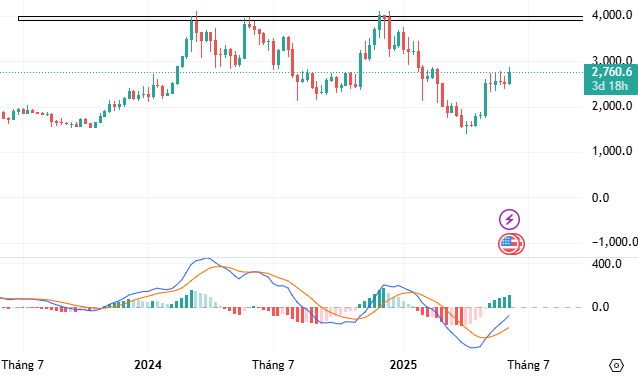
ETH Weekly Chart: 2023 – 2025 – Source: TradingView
Returning to the daily chart, ETH sustains its recovery after breaking out of a Darvas box pattern. Additionally, ETH’s price has crossed above the 50-day SMA in May 2025, confirming its departure from the bearish trend.
Furthermore, ETH’s price continues its recovery after the occurrence of a golden cross between the 50-day SMA and the 100-day SMA, accompanied by a buy signal on the MACD indicator. This indicates heightened support for the positive mid-term scenario.
Considering these factors, the writer anticipates that ETH’s price may sustain its recovery towards the previous high from December 2024, ranging from 3,900 to 4,000 USD.
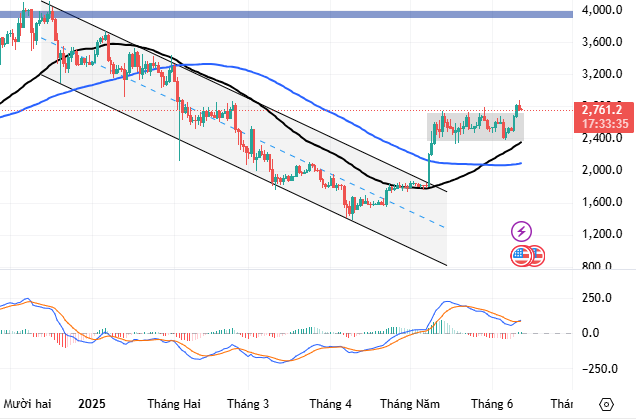
ETH Daily Chart: 2024 – 2025 – Source: TradingView
Vietstock Consulting Technical Analysis Department
– 09:00 14/06/2025
Technical Analysis for June 9: Caution Prevails

The VN-Index and HNX-Index both witnessed a slight dip in the morning session, with a decrease in trading volume, indicating a cautious sentiment among investors.
Technical Analysis for June 6: A Growing Sense of Pessimism

The VN-Index and HNX-Index both witnessed a decline in points during the morning session, with an increase in trading volume, indicating a rather pessimistic sentiment among investors.
Market Tug-of-War: The Ongoing Battle Unveiled

The VN-Index witnessed a slight dip with a tug-of-war session, coupled with below-average trading volume. A throwback is currently unfolding as the VN-Index has recently breached a strong resistance level of 1,320-1,340 points. Notably, the MACD indicator has been narrowing its gap with the Signal line in recent sessions. Should this indicator flash a sell signal in the upcoming periods, the risk of a short-term correction may emerge.
Technical Analysis for May 27: Mixed Signals Emerge

The VN-Index and HNX-Index both climbed in the morning session, but technical indicators painted a mixed picture, suggesting that investor sentiment is somewhat cautious.
“Markets Soaring High: Vietstock Daily Overview for May 21, 2025”

The VN-Index surged, dismissing the previous two sessions’ losses with the emergence of a White Marubozu candlestick pattern. This reflects a highly optimistic sentiment among investors. However, trading volume needs to show a marked improvement for the index to sustain its upward trajectory. If the VN-Index firmly holds above the current level, it may have the potential to revisit the old peak of March 2025 (around the 1,320-1,340 range). Notably, the MACD indicator has maintained a buy signal since late April 2025, boding well for the short-term outlook if this status quo persists.

 – Short-Term Tug-of-War")


 Projected to Hit a New All-Time High: Here’s When")