
I. MARKET ANALYSIS OF JULY 30, 2025
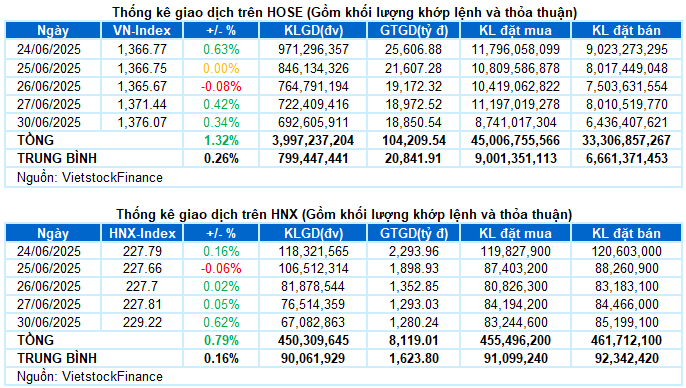
– The main indices increased during the trading session on July 30. Specifically, the VN-Index reached 1,376.07 points, up 0.34%; HNX-Index ended the session at 229.22 points, up 0.62%.
– The matching volume on the HOSE floor decreased slightly by 6.1%, reaching more than 636 million units. Meanwhile, the HNX floor recorded more than 65 million units, roughly equal to the previous session.
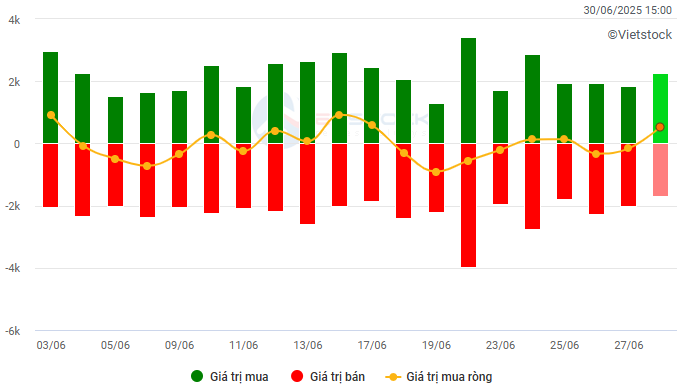
– Foreign investors net bought with a value of more than VND 592 billion on the HOSE and net sold more than VND 37 billion on the HNX.
Trading value of foreign investors on HOSE, HNX, and UPCOM by day. Unit: VND billion
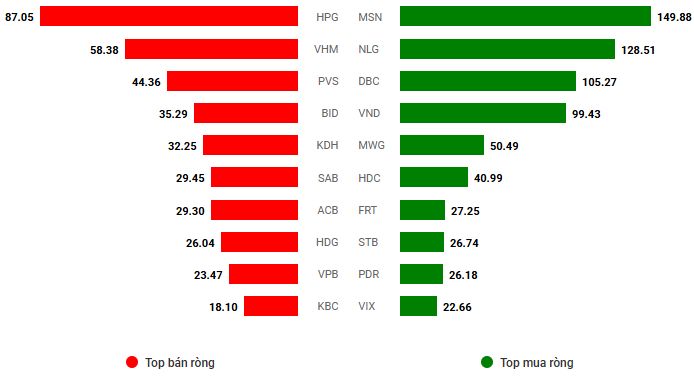
Net trading value by stock code. Unit: VND billion
– The market maintained a green shade during the first session of the week with a quite volatile trading session. The VN-Index surged right after the opening and approached the 1,377-point threshold, but short-term profit-taking pressure quickly emerged, causing the index to narrow its gain later. However, the pillar group still did a good job of leading, helping the VN-Index fluctuate stably around the 1,375-point threshold for most of the morning session. Entering the afternoon session, the market suddenly faced strong selling pressure at the end of the session, but buying power was still timely, helping the VN-Index to maintain its gains and ending June at the threshold of 1,376.07 points.
– In terms of impact, VCB had the most positive impact when bringing nearly 0.6 points to VN-Index. Following were TCB, BID, FPT, and BCM, which also contributed a total of 1.3 points to the overall index. In contrast, VHM and HPG were the codes with the most negative impact, but they also took only half a point from the index.
– VN30-Index ended the session up 0.11%, reaching 1,477.56 points. The breadth was tilted to the buying side with 16 gainers, 10 losers, and 4 unchanged. BCM led the board with a gain of 1.9%. Following were BVH, VIB, and VJC, which also recorded gains of over 1%. On the losing side, SAB was at the bottom with a loss of 1.3%.
All industry groups closed the first session of the week in the green. The industry group led the market with a gain of nearly 1%, thanks to the positive contribution of stocks such as ACV (+1.65%), VJC (+1.03%), PHP (+1.62%), HUT (+3.2%), HAH (+2.12%), GMD (+4.51%), CTD (+1.79%), and PAP (+5.49%),…
In addition, information technology, energy, and telecommunications groups also recorded equivalent gains with green shades stretching across stocks such as FPT (+0.77%), CMG (+5.76%); BSR (+0.56%), PVS (+2.49%), PVD (+1.26%), PVC (+2.61%), AAH (+2.63%); VGI (+1.06%), FOX (+0.64%), YEG (+0.81%), and ELC (+1.79%).
The healthcare group retained a weak green shade thanks to support from DCL (+2.91%), OPC (+0.85%), VDP (+1.37%), DP3 (+1.14%),… despite adjustment pressure at many codes such as DBD (-0.56%), PMC (-9.65%), MKP (-2.01%), DVM (-1.41%), and DAN (-1.25%).
VN-Index maintained its uptrend and closely followed the Upper Band of Bollinger Bands. The MACD indicator continued to widen the gap with the Signal line after giving a buy signal, indicating that the short-term positive outlook is still supported. However, the downside came from liquidity as the trading volume failed to surpass the 20-session average, reflecting investors’ cautious sentiment that has not yet been removed. If this is not improved in the coming sessions, the risk of a volatile adjustment should be noted.
II. TREND AND PRICE MOVEMENT ANALYSIS
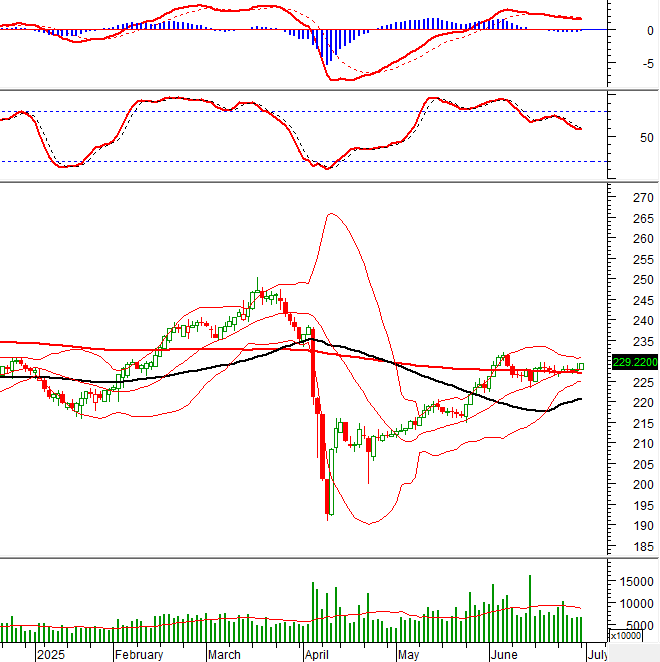
VN-Index – Trading volume remains low
VN-Index maintained its uptrend and closely followed the Upper Band of Bollinger Bands. The MACD indicator continued to widen the gap with the Signal line, giving a buy signal and indicating a supported short-term positive outlook.
However, the downside came from liquidity as the trading volume failed to surpass the 20-session average, reflecting investors’ cautious sentiment. If this does not improve in the coming sessions, the risk of a volatile adjustment should be noted.

HNX-Index – Testing the Middle Line of Bollinger Bands
HNX-Index increased after testing the Middle Line of Bollinger Bands, while trading volume remained low.
Currently, the Stochastic Oscillator indicator is likely to give a buy signal again. If this is confirmed in the coming sessions, the risk of an adjustment will be reduced.
Money Flow Analysis
Fluctuation of smart money flow: The Negative Volume Index indicator of VN-Index cut above the 20-day EMA line. If this state continues in the next session, the risk of an unexpected drop (thrust down) will be limited.

Foreign capital flow fluctuation: Foreign investors returned to net buying in the trading session on July 30, 2025. If foreign investors maintain this action in the coming sessions, the situation will be even more optimistic.
III. MARKET STATISTICS ON JULY 30, 2025
Economic Analysis & Market Strategy Division, Vietstock Consulting Department
– 17:12 30/07/2025
The Surprising Dividend of The Mobile World

For the first time in 2 years, Mobile World Investment Corporation has increased its cash dividend ratio from 5% to 10%, and is expected to pay out nearly VND 1,480 billion to shareholders in this round.
The Big Buy: Foreign Investors Pump Over $21 Million into Vietnam’s Stock Market in a Single Session

The foreign sector returned to net buying on the HoSE, while net selling was witnessed on the HNX and UPCOM.
“Stocks This Week: VN-Index Surges Past 1,370 Points, a Stealth Stock Peaks 14 Times This Year”

The stock market is on fire with the VN-Index surging past 1,370 points. Amid this frenzy, a stealthy stock has quietly soared to new heights, recording a staggering 14 peak visits since the year’s turn, with its share price now flirting with the 170,000 VND mark. As foreign investors offload hundreds of billions in the week of June 23-27, what’s the underlying story here? And why is Vietcap’s CEO splashing billions on VCI stock?
Should You Buy or Sell When the VN-Index Nears 1,400 Points?

The business results for the first half of the year, alongside the looming deadline for the postponement of the reciprocal tax agreement between Vietnam and the US, are set to impact the stock market in the week ahead.
The Flow of Funds: What Does the Hesitant Money Trail Tell Us?

The VN-Index witnessed its second consecutive week of robust gains, surging past the 1370-point mark. The bulk of these gains were concentrated in the first two trading sessions, with the latter three sessions experiencing minimal fluctuations. Notably, excluding the high-volume trading session on June 24th, the average weekly trading volume was relatively low.


 is set to transform with two upcoming ‘super urban’ projects, boasting a combined investment of VND 54,500 billion and a planned population capacity of 155,000 people.")


 is set to transform with two upcoming ‘super urban’ projects, boasting a combined investment of VND 54,500 billion and a planned population capacity of 155,000 people.")


