Technical signals for VN-Index
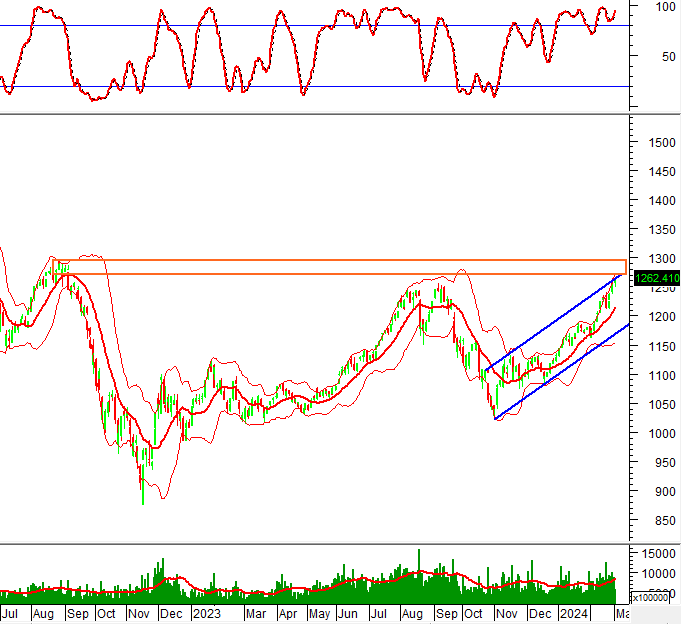
In the morning trading session on March 4, 2024, VN-Index increased its points while showing a candlestick pattern similar to Hammer accompanied by expected higher-than-average 20-day volume, indicating optimistic investor sentiment.
Currently, VN-Index is approaching the previous peak in August 2022 (equivalent to 1,270-1,295 points) and testing the upper side of the Bullish Price Channel, therefore there is a high probability of a tug of war here in the upcoming sessions.

Technical signals for HNX-Index
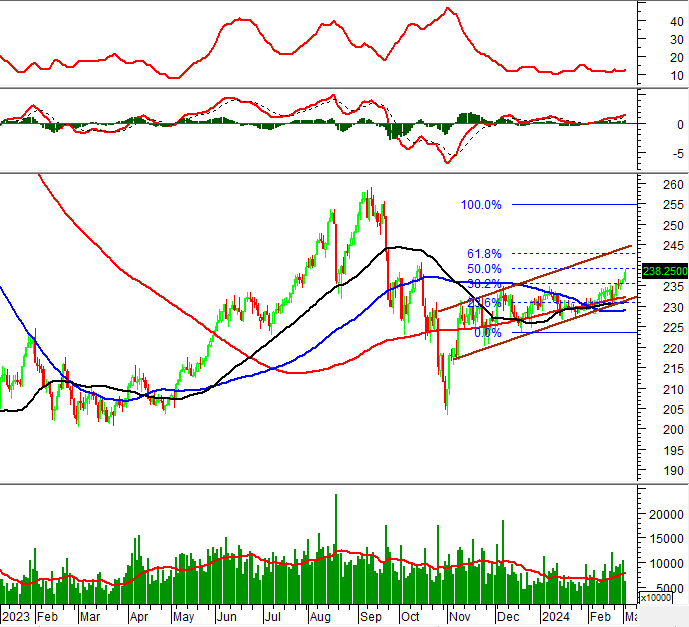
In the trading session on March 4, 2024, HNX-Index increased its points and continued to move within the Bullish Price Channel, while the ADX remained below 20, indicating that the sideways upward trend will continue in the coming sessions.
The trading volume is expected to be higher than the 20-day average at the end of the session, reflecting the investors’ optimistic sentiment.
Currently, HNX-Index has successfully surpassed the Fibonacci Projection 38.2% level (equivalent to the range of 234-237 points), making it a good support level for the index in the near future.

NLG – Nam Long Investment Corporation
In the morning session on March 4, 2024, NLG hit the trading limit up and showed a Rising Window candlestick pattern along with a breakthrough in trading volume that surpassed the 20-day average, indicating active trading activity.
In addition, the MACD indicator has given a buy signal and continues to stay above the 0 level, confirming the upward trend.
Currently, NLG is moving within the Bullish Price Channel and approaching the Fibonacci Retracement 61.8% level (equivalent to the range of 45,500-47,800), which is also the previous peak in May 2022, so there is a high possibility of fluctuations at this level in the near future.

QNS – Quang Ngai Sugar Company
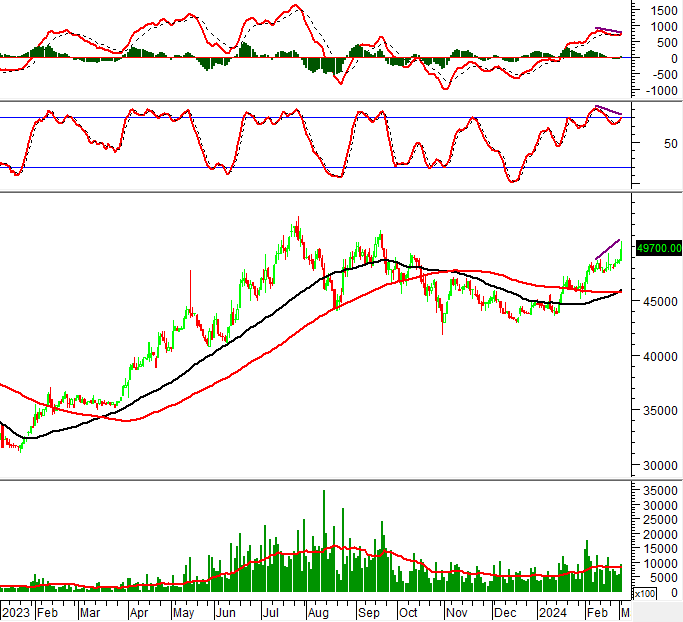
In the morning trading session on March 4, 2024, the stock price of QNS continued to rise after the appearance of a Golden Cross signal between the 50-day SMA and the 100-day SMA, indicating positive prospects.
The trading volume in the morning session improved and exceeded the 20-day average, showing a positive investor sentiment.
However, the Stochastic Oscillator indicator is showing bearish divergence around the overbought zone. If the indicator gives a sell signal, there will be a short-term adjustment risk.

Technical Analysis Department, Vietstock Advisory Department


