Technical Signal of VN-Index
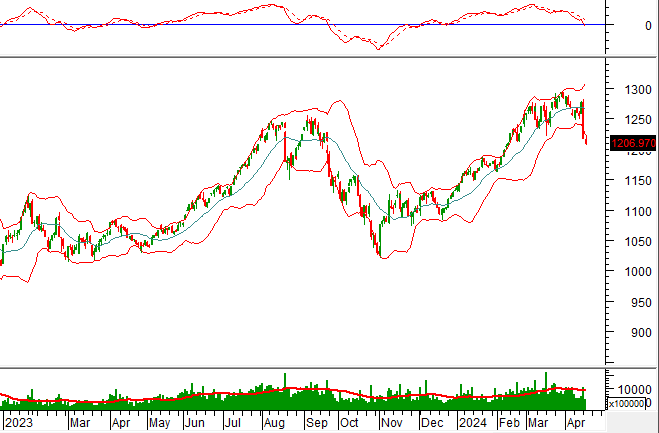
In the trading session on the morning of April 16, 2024, VN-Index fell slightly along with a slight increase in trading volume in the morning session, indicating that investors’ pessimism remains.
In addition, the index is hugging the lower Bollinger Band as the MACD indicator continues to trend down and widens the gap with the signal line and crosses below the 0 level after giving a sell signal earlier. This suggests that the outlook for the near future remains quite negative.
Technical Signal of HNX-Index
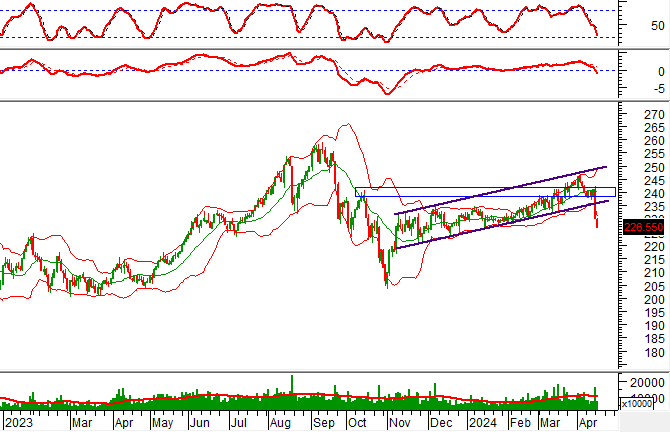
In the trading session of April 16, 2024, HNX-Index decreased with an increase in volume during the morning session, and the author expects it to exceed the 20-session average by the end of the session, indicating that investor sentiment is quite negative.
Currently, the index has fallen below the lower edge of the bullish price channel as the MACD indicator continues to widen the gap with the signal line after giving a sell signal. This suggests that a pessimistic scenario is likely to continue.
ASM – Sao Mai Group Corporation
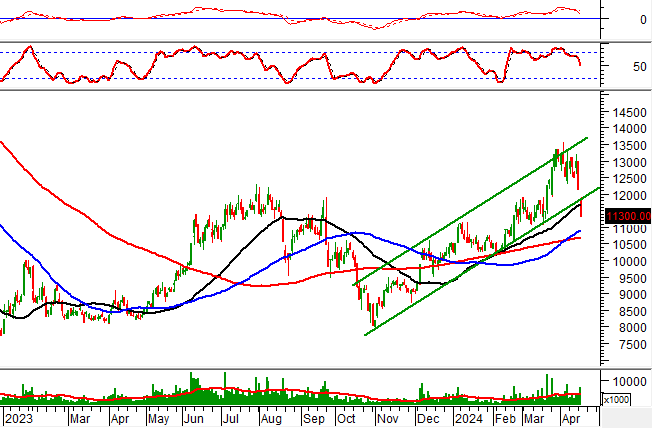
In the morning session of April 16, 2024, ASM hit the floor and at the same time, the Falling Window candlestick pattern appeared along with a sharp increase in trading volume, surpassing the 20-session average, indicating that investor sentiment is very pessimistic.
Currently, the stock has fallen below the lower edge of the bullish price channel, while the MACD indicator continues to weaken after giving a sell signal earlier, suggesting that the downtrend is not showing signs of ending.
In addition, the price of ASM has crossed below the 50-day SMA. If the correction continues, the group of 100-day SMA and 200-day SMA (equivalent to the 10,500-11,000 range) will be good support in the coming sessions.
DIG – Development Investment Corporation
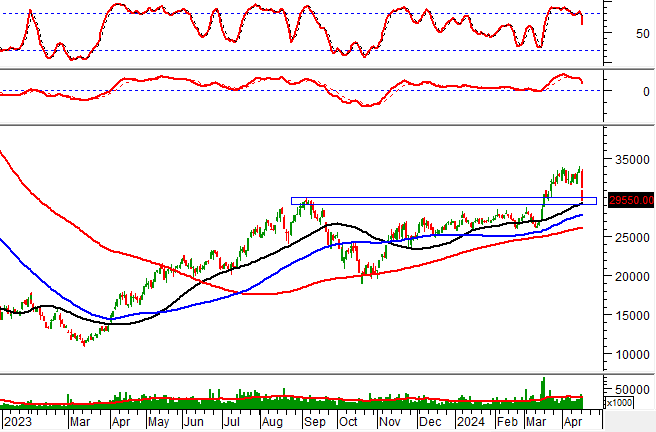
In the morning session of April 16, 2024, DIG dropped significantly and at the same time, the Falling Window candlestick pattern appeared along with increased liquidity in the morning session, which the writer expects to surpass the 20-day average by the end of the session, indicating that investor sentiment is quite pessimistic.
Currently, the stock is testing the previous peak that was broken in September 2023 (equivalent to the range of 29,000-30,000) while the Stochastic Oscillator indicator continues to trend down after giving a sell signal and falling out of the overbought zone. In the coming sessions, if the stock price continues to decline and falls out of this peak range, the short-term outlook will be even more pessimistic.
Technical Analysis Department, Vietstock Consulting Room


