


BTC: Successfully Tests Fibonacci Projection 61.8% Level
On the weekly chart, BTC surged after successfully testing the Fibonacci Projection 61.8% level (equivalent to the $53,500-$60,000 region). However, the Stochastic Oscillator indicator is venturing deep into overbought territory. If sell signals reappear and it falls out of this region, the risk of a correction increases in the coming period.
As mentioned in the Q2 2024 Crypto Report (Issue 1), BTC is in an upward trajectory in the medium-term trend and continuously tests the Neckline of the Rounding Bottom pattern. Going forward, if BTC successfully breaks through this resistance level, the next price target will be the $120,000-$125,000 region.
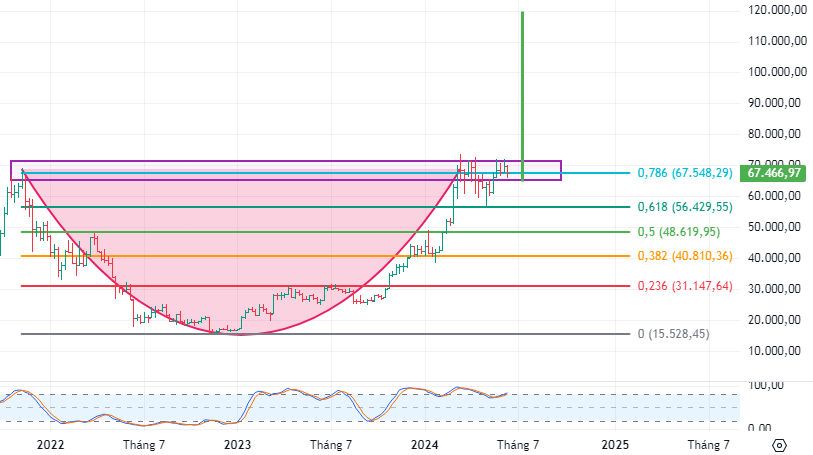
BTC Chart for 2022 – 2024 – Source: TradingView
Back to the daily chart, BTC dropped below the Middle curve of the Bollinger Bands, while the MACD indicator continues to widen the gap with the Signal line after a previous sell signal, indicating that the short-term outlook is turning negative.
Additionally, the Stochastic Oscillator continues downward after a previous sell signal, suggesting that investor sentiment remains bearish.
Overall, short-term risk signals have emerged. Investors should prioritize risk management, consider reducing their positions, and only deploy capital when more positive signals appear in the market.
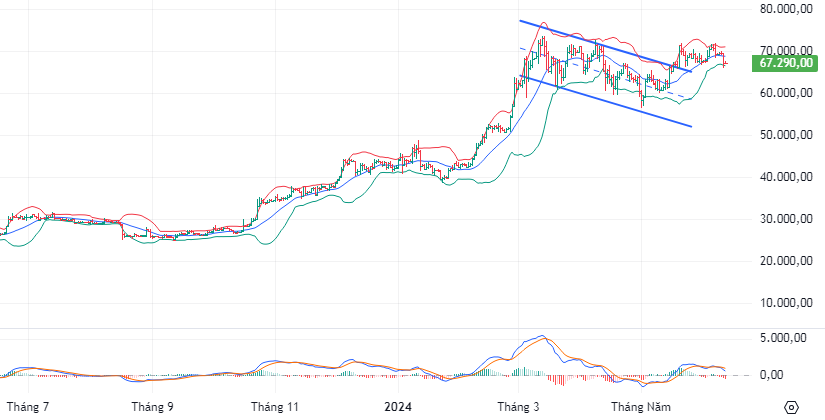
BTC Chart for 2023 – 2024 – Source: TradingView
ETH: Death Cross Appears
On the daily chart, ETH exhibits a death cross between the 50-day SMA and the 100-day SMA, and the failure to retest the March 2024 high (around $3,900-$4,200) suggests that the medium-term outlook is losing momentum.
Moreover, the MACD indicator continues downward after providing a sell signal. If the sell signal is sustained, the correction scenario may persist in the upcoming sessions.
Currently, the 23.6% Fibonacci Projection level (approximately $3,300-$3,500) is considered a relatively important support level in ETH‘s ongoing correction.
Based on these signals, it is anticipated that ETH may retest the 50-day SMA and consolidate before resuming its long-term upward trajectory.
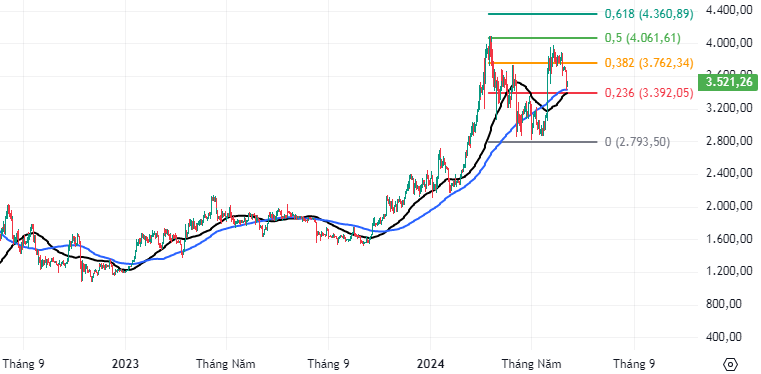
ETH Chart for 2023 – 2024 – Source: TradingView
Technical Analysis Department, Vietstock Consulting


