Technical Signals for the VN-Index
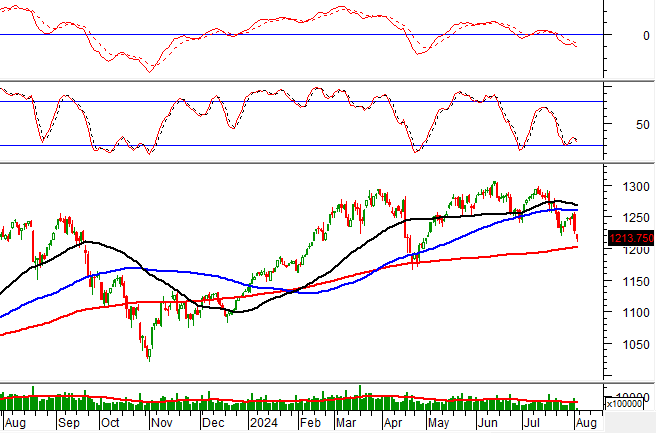
During the trading session on the morning of August 2, 2024, the VN-Index witnessed a significant drop in points, along with a slight decline in trading volume. This indicates a rather pessimistic sentiment among investors.
At present, the VN-Index is trending towards retesting the 200-day SMA as the Stochastic Oscillator indicator flashes a sell signal again. If the sell signal is sustained and the index falls below this support level, the risk of a correction will heighten in the upcoming sessions.

Technical Signals for the HNX-Index
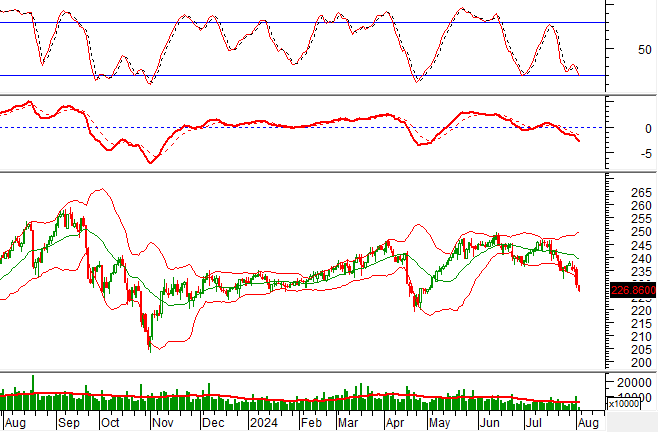
On August 2, 2024, the HNX-Index experienced a slight dip, coupled with a substantial drop in trading volume during the morning session, reflecting investors’ cautious attitude.
Moreover, the HNX-Index remains close to the lower band of the Bollinger Bands, while the MACD indicator continues its downward trajectory after previously giving a sell signal. This suggests that the short-term corrective trend is likely to persist in the forthcoming sessions.

BFC – Binh Dien Fertilizer Joint Stock Company
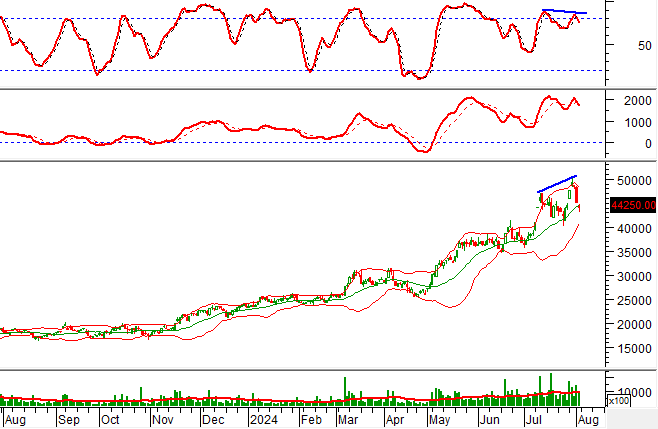
On the morning of August 2, 2024, BFC witnessed a price decline and the formation of a High Wave Candle pattern, accompanied by a substantial increase in trading volume. This indicates investors’ uncertainty.
Additionally, the Stochastic Oscillator indicator has flashed a sell signal once more and a Bearish Divergence has emerged, suggesting a less optimistic outlook for the upcoming sessions.

VRE – Vincom Retail Joint Stock Company
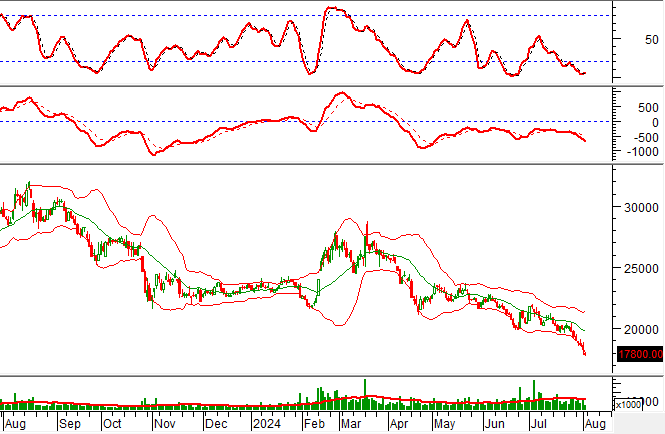
On August 2, 2024, VRE extended its losing streak to seven consecutive sessions, along with a slight increase in trading volume. This reflects investors’ pessimistic sentiment.
Furthermore, the stock price remains close to the lower band of the Bollinger Bands, and the MACD indicator continues to widen the gap with the signal line after previously giving a sell signal. This indicates a high probability that the corrective phase will persist in the upcoming sessions.

Technical Analysis Team, Vietstock Consulting Department


