After the 2007-2009 financial crisis, major stock market indices such as the Dow Jones and S&P 500 experienced significant growth, surpassing pre-crisis levels and reaching much higher peaks.
However, a pertinent question arises when examining the Vietnamese stock market: Why has the VN-Index remained stagnant around the 1,000-point mark for over 20 years? In comparison to other markets, the VN-Index appears to be “standing still,” lacking the breakthrough expected from its potential.
Following an in-depth analysis of valuation and historical tax-excluded profit growth trends of the VN-Index and S&P 500, Dragon Vietnam Securities (VDSC) has offered some insights into this phenomenon.
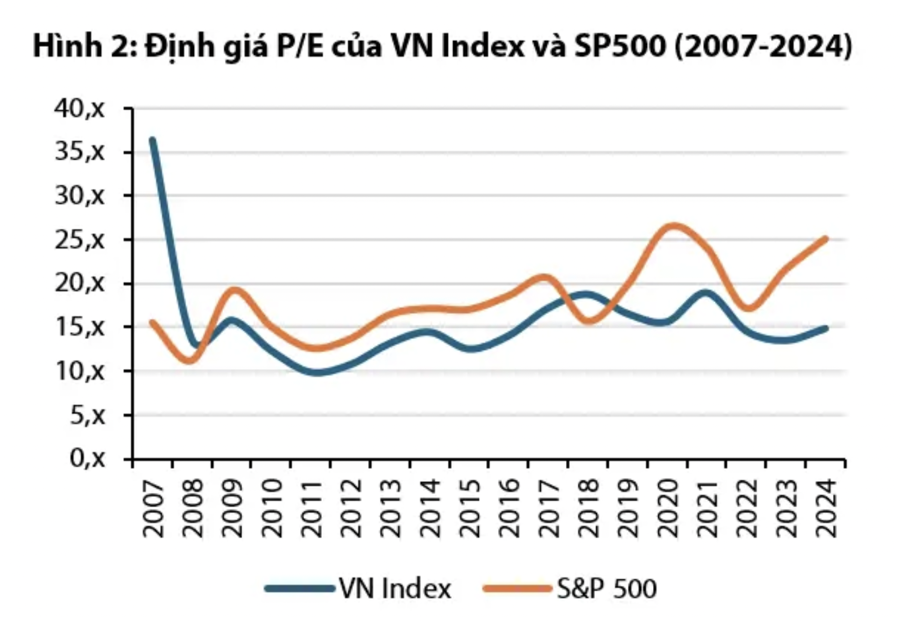
The occurrence of an asset bubble at the time when the VN-Index reached the 1,000-point threshold in 2006-2007 led to a misunderstanding about the growth of its intrinsic value.
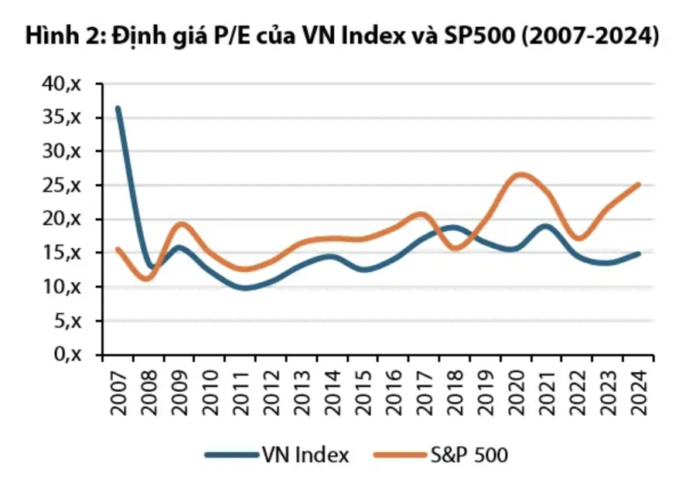
During this period, the market sustained a high valuation of P/E 35 times, enabling the VN-Index to peak historically in March 2007 at 1,155 points. At this valuation, coupled with the CAGR of VN-Index’s post-tax profit from 2007 to 2015, which was 1.7%, the implied yield when investing in the VN-Index portfolio was a mere 4.2%. This return was relatively low and unattractive when compared to the risk-free savings deposit interest rates available at the same time.
Consequently, this valuation implied an asset bubble for the VN-Index during that phase. Assuming a reasonable average valuation for the VN-Index over the long term is 15 times, the index’s fair value at that juncture would have been in the range of 350-500 points, equivalent to the market bottom witnessed in 2008.
Following a period of repricing from late 2008 to early 2009, the investment performance between the two indices became more aligned. However, the S&P 500 has witnessed a stronger growth trajectory since 2016.
In 2007, the VN-Index was overvalued compared to the S&P 500 and exhibited a bubble, and choosing this year as a benchmark would highlight a significant disparity in investment performance.
Post the global financial crisis (2007-2009), the VN-Index adjusted to a more reasonable level and has maintained this range until the present, exhibiting valuation fluctuations comparable to the S&P 500. Therefore, if we select 2009 as the benchmark year, when both indices touched bottom and valuations normalized, the investment performance of the VN-Index and S&P 500 from that point onward would be relatively similar.
The comparable investment performance during the period (2009-2024) is driven by the relatively aligned profit growth rates of the S&P 500 and VN-Index in these respective phases.
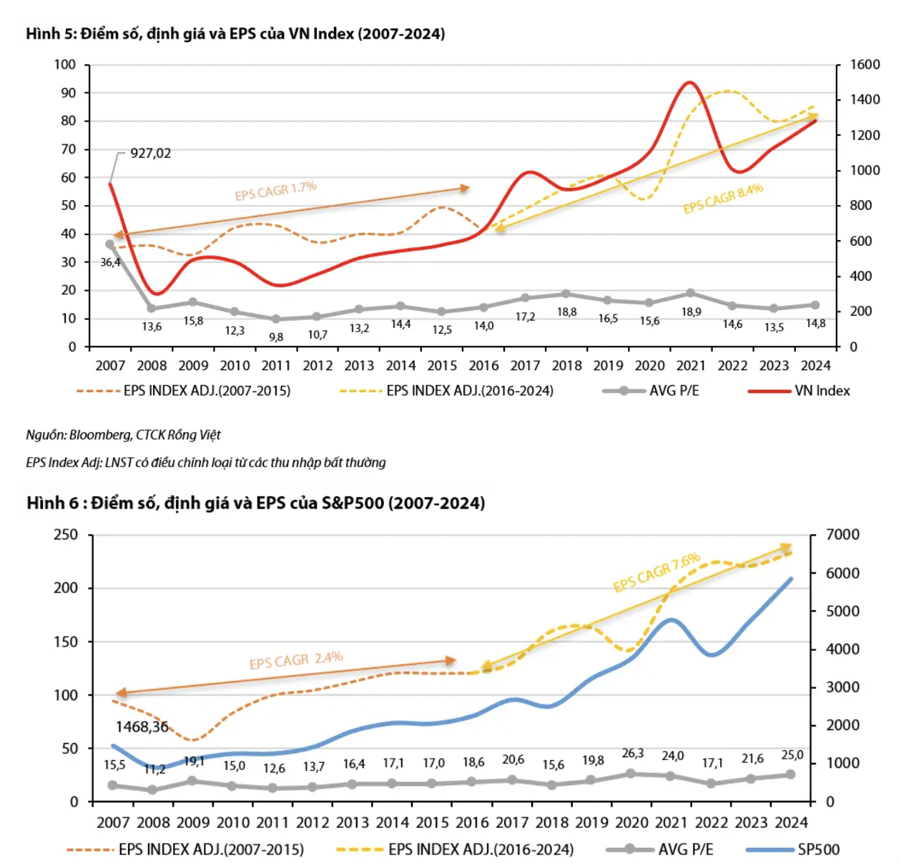
Despite the VN-Index exhibiting a higher compound annual growth rate (CAGR) of EPS at 8.4% compared to the S&P 500’s 7.6% from 2016 onwards, the latter has witnessed a more substantial surge, attributable to a more significant repricing. Specifically, the average P/E valuation of the S&P 500 escalated from 15.3 times to 21 times (+37%), whereas the VN-Index only experienced a slight increase from 15.4 times to 16 times (+4%).
In contrast, Huynh Hoang Phuong, a wealth management advisor at FDIT, attributes the stagnant nature of the VN-Index to the characteristics of a frontier market such as Vietnam. Even some emerging markets fail to witness substantial index growth, as observed in more developed markets.
Regarding the VN-Index, its stagnation at this level is partly due to the cyclical nature of the majority of listed stocks, such as those in the real estate sector. Although its weight has diminished, real estate, along with banking, still constitutes a significant proportion of the VN-Index.
Additionally, the dominance of individual investors in the stock market contributes to heightened volatility and impedes significant growth due to the influence of psychological factors.
The Market Beat: A Tale of Diverging Fortunes
At the close, the VN-Index witnessed a slight dip of 2.98 points (-0.23%), settling at 1,287.94; while the HNX-Index shed 0.8 points (-0.34%) to close at 234.91. The market breadth tilted towards decliners, with 436 stocks falling against 272 advancing stocks. The VN30-Index basket saw a balanced performance, with 19 decliners, 8 advancers, and 3 stocks remaining unchanged, maintaining a green-red equilibrium.
The Market Beat: VN-Index Hanging on at 1,280 Points
The market closed with the VN-Index down 1.6 points (-0.12%) to 1,279.48, while the HNX-Index fell 0.69 points (-0.3%) to 228.26. The market breadth tilted towards decliners with 381 losers and 287 gainers. The large-cap stocks in the VN30-Index basket witnessed a similar trend, with 18 stocks declining, 9 advancing, and 3 unchanged.
The Market Beat: A Tale of Diverging Fortunes, VN-Index Falters at the 1,295 Mark
The market ended the session in negative territory, with the VN-Index down 2.05 points (-0.16%) to close at 1,286.34. The HNX-Index followed suit, falling 0.65 points (-0.28%) to 230.72. It was a sea of red across the broader market, as sellers dominated with 395 declining stocks compared to 294 gainers. The large-cap VN30-Index also painted a similar picture, with 19 stocks in the red, 8 in the green, and 3 unchanged.


