Technical Signals for the VN-Index
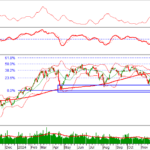
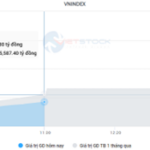
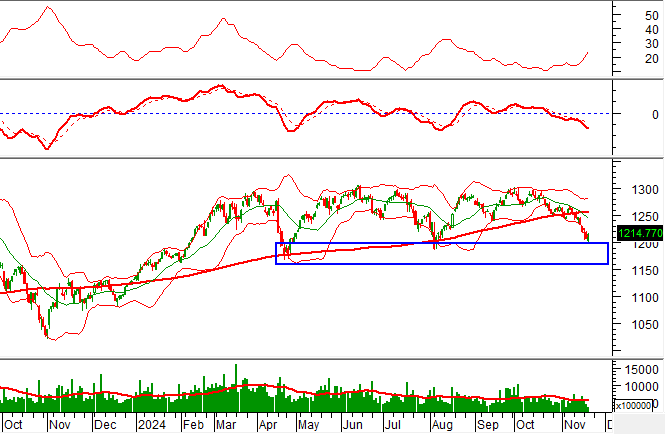
During the trading session on the morning of November 20, 2024, the VN-Index witnessed a rise in points, accompanied by a significant surge in trading volume. This indicates a shift towards a more positive outlook.
Additionally, the ADX indicator is currently moving within the gray zone (20 < adx < 25), providing further insights into the market dynamics.
Technical Signals for the HNX-Index
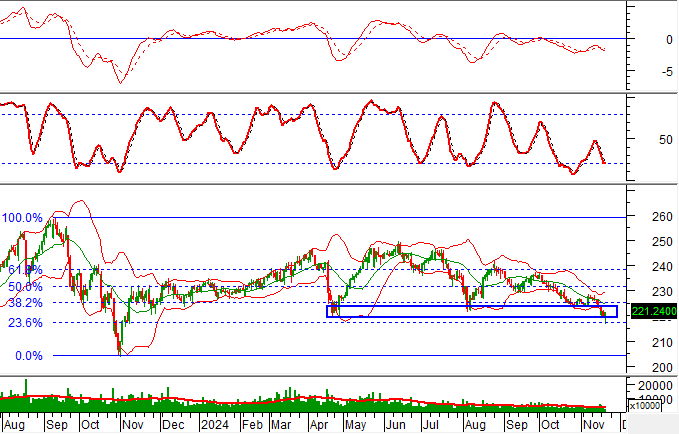
On November 20, 2024, the HNX-Index displayed a positive performance, with a notable increase in trading volume during the morning session. This suggests an improvement in investor sentiment.
Moreover, the HNX-Index is retesting its old bottom from April 2024 (corresponding to the 220-225-point region) as the Stochastic Oscillator continues its downward trajectory, venturing deeper into oversold territory. A resurgence of buy signals would be a welcome development, alleviating the gloom surrounding the index.
DXG – Real Estate Development Corporation
On the morning of November 20, 2024, DXG soared to its daily limit-up price, forming a White Marubozu candlestick pattern, and witnessed a surge in trading volume above the 20-session average. This indicates active participation from investors.
At present, the stock price is retesting its mid-term downward trendline, and the Stochastic Oscillator is providing a buy signal. In a bullish scenario, if the stock price breaks out above this downward trendline, a short-term recovery may unfold in upcoming sessions.
Furthermore, the stock price is finding support from the group of SMA 50 and SMA 200 lines, indicating that mid- and long-term prospects remain optimistic.
VIB – Vietnam International Bank
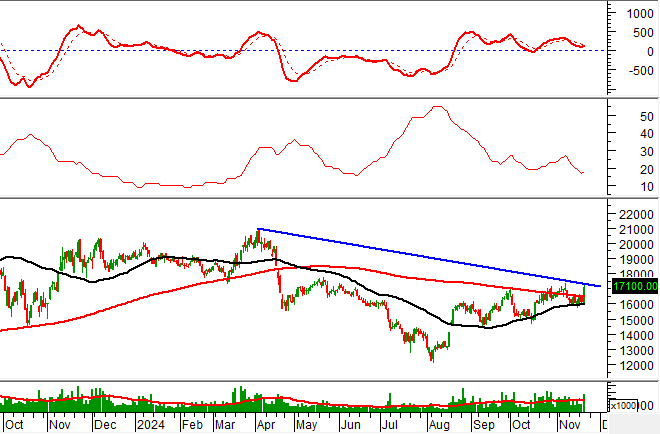
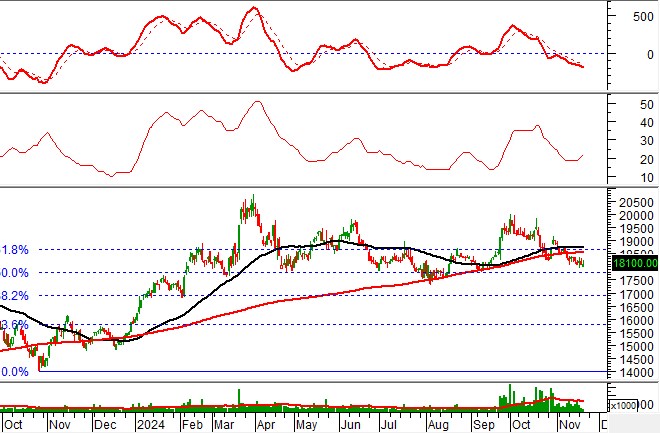
On the morning of November 20, 2024, VIB witnessed a price increase, accompanied by a significant rise in trading volume, reflecting improved investor sentiment.
Additionally, the stock price is retesting the Fibonacci Projection 50% level (approximately 17,500-18,000) as the ADX indicator moves within the gray zone (20 < adx < 25). However, the MACD indicator is narrowing its gap with the Signal line after previously giving a sell signal. A resurgence of buy signals in an optimistic scenario could pave the way for a recovery in the upcoming phases.
Technical Analysis Team, Advisory Department, Vietstock
Technical Analysis for the Session on November 22: A Tale of Diverging Fortunes
The VN-Index and HNX-Index rose in tandem, with the emergence of a Doji candlestick pattern indicating investor indecision in the market. This cautious sentiment is reflected in the hesitancy of buyers and sellers, resulting in a stalemate that led to the formation of the Doji. As the markets hover at these levels, investors are carefully weighing their options, considering the potential risks and rewards of their next move.
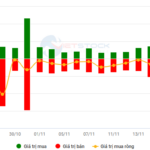
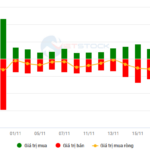
The Market Beat: Foreigners End Selling Streak
The market closed with slight losses, as the VN-Index dipped by 0.23 points (-0.02%) to finish at 1,228.10, while the HNX-Index shed 0.47 points (-0.21%), closing at 221.29. The market breadth tilted towards decliners, with 371 tickers in the red versus 341 in the green. Meanwhile, the large-cap VN30 index displayed a more balanced performance, with 11 tickers losing ground against 13 advancing stocks and 6 remaining unchanged.
The Optimistic Outlook: Can We Expect a Positive Shift?
The VN-Index surged amidst a recent spate of losses, indicating a strong rebound. Accompanying this rise was a surge in trading volume, surpassing the 20-day average, signifying a return of liquidity to the market. The Stochastic Oscillator, a key technical indicator, has now entered oversold territory and is signaling a buy. Should this indicator continue to climb, we can expect a further positive shift in market sentiment.
Technical Analysis for the Afternoon Session on November 21st: Market Sentiment Clouded by Indecision
The VN-Index and HNX-Index both climbed, forming a Doji candlestick pattern, indicating investor indecision. This pattern suggests a potential shift in market sentiment, as investors appear uncertain about the future direction of the market. With the indices hovering at these levels, it’s a pivotal moment for Vietnam’s stock market, leaving investors wondering if this is a mere pause or a sign of things to come.


