
I. MARKET ANALYSIS OF THE STOCK MARKET BASED ON DATA FROM FEBRUARY 18, 2025
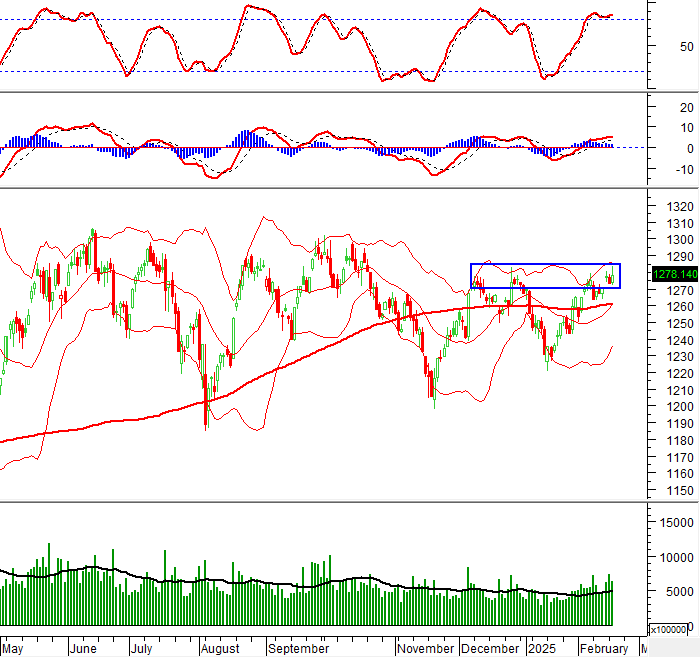
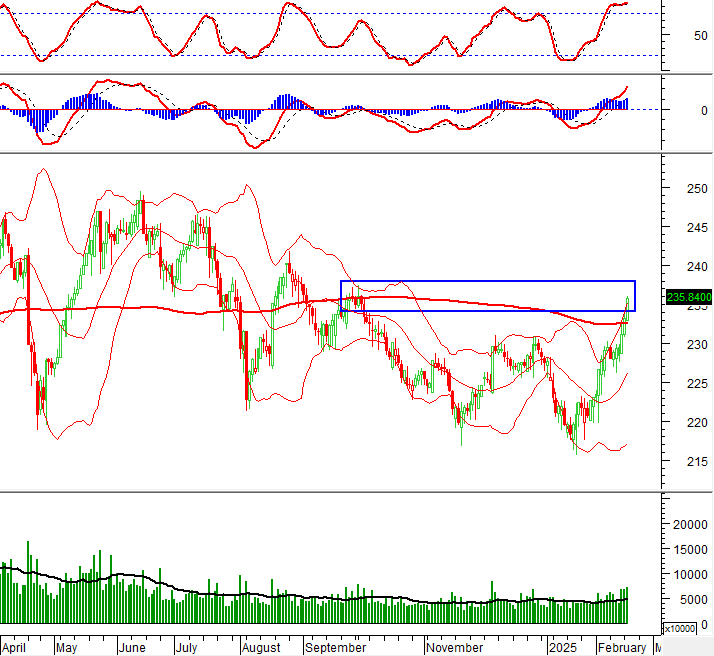
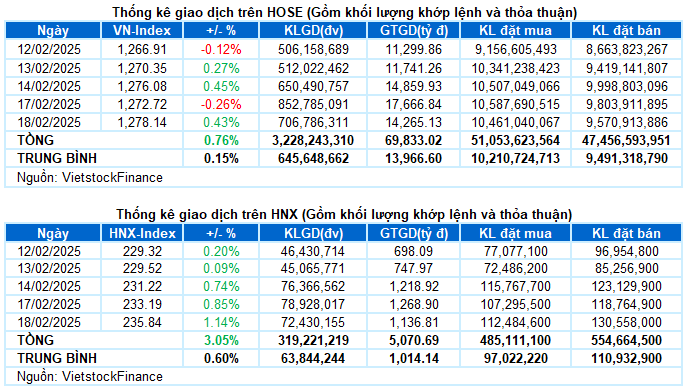
– The main indices gained points during the trading session on February 18. The VN-Index closed at 1,278.14 points, a 0.43% increase; while the HNX-Index rose by 1.14% to reach 235.84 points.
– The matching volume on the HOSE reached nearly 631 million units, a 14.7% decrease compared to the previous session. On the other hand, the matching volume on the HNX increased by 5.5%, reaching over 72 million units.
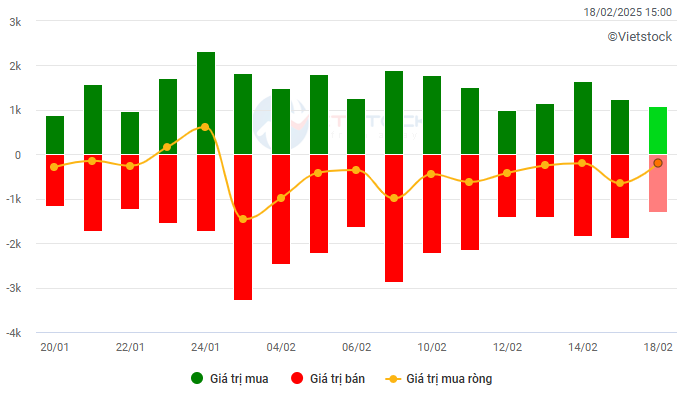
– Foreign investors net sold on the HOSE with a value of nearly VND 207 billion and net bought on the HNX with a value of nearly VND 12 billion.
Trading value of foreign investors on HOSE, HNX and UPCOM. Unit: VND billion
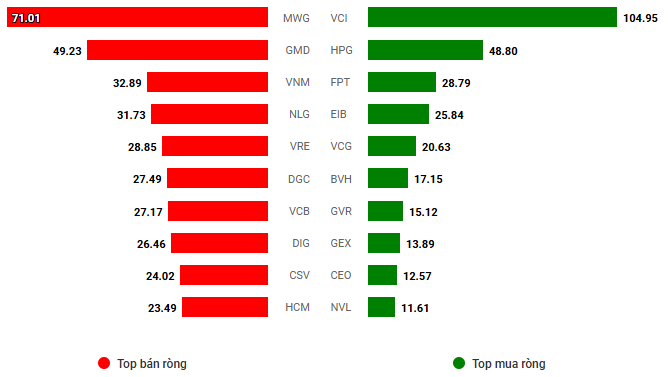
Net trading value by stock code. Unit: VND billion
– The market regained its broad gains during the February 18 session. The strong comeback of large-cap stocks helped the VN-Index break through from the beginning of the session, quickly surpassing the 1,280-point mark. However, the upward momentum did not last as buying power gradually weakened from the end of the morning session, causing the index to narrow its range. From a high of more than 10 points, the VN-Index ended the session with a gain of only 5.42 points, closing at 1,278.14 points.
– In terms of impact, BVH, HPG, and BID were the main contributors, helping the VN-Index gain nearly 2 points. On the other hand, only LPB had a significant negative impact, taking away almost half a point from the overall index.
– The VN30-Index ended the session with a 0.25% increase, settling at 1,337.39 points. Although buyers still held the upper hand, with 22 stocks rising, 6 falling, and 2 remaining unchanged, the upward momentum cooled down significantly towards the end of the day. Most stocks ended the session with slight gains, with only a few maintaining their strong breakthrough momentum: BVH hitting the ceiling, VRE rising 2.4%, and HPG climbing 1.5%. Conversely, LPB faced strong selling pressure, falling nearly 2%.
The bullish sentiment slightly prevailed, but the sectoral performance still showed divergence. The non-essential consumer group topped the leaderboard with a 0.65% increase as many stocks attracted positive buying interest, such as GEE (+6.26%), MSH (+2.03%), PLX (+1.31%), TLG (+4.02%), HHS (+4.76%), PET (+1.92%), and DRC (+1.05%). However, several stocks were still dominated by selling pressure, including PNJ (-1.89%), TNG (-0.43%), HTG (-2.31%), SAS (-1.47%), and GDT (-1.39%).
The financial and real estate groups were the main drivers of the strong breakthrough in the morning session, but profit-taking pressure narrowed their gains towards the end of the day to 0.4%. Insurance stocks stood out the most within the financial group, with BVH (+6.9%), MIG (+4.44%), PVI (+2.14%), BMI (+3.81%), BIC (+3.03%), PTI (+2.23%), BLI (+5.05%), and VNR (+4%) all surging. Additionally, several real estate stocks also witnessed positive trading, including VRE (+2.43%), CEO (+3.01%), DIG (+2.39%), NVL (+1.52%), DXG (+1.03%), DXS (+2.81%), and SJS (+3.04%).
On the other hand, the industrial group continued to lag as adjustment pressure persisted across the board, notably in stocks like ACV (-2.6%), MVN (-3.43%), HAH (-1.13%), VSC (-3.51%), and VOS (-1.21%).
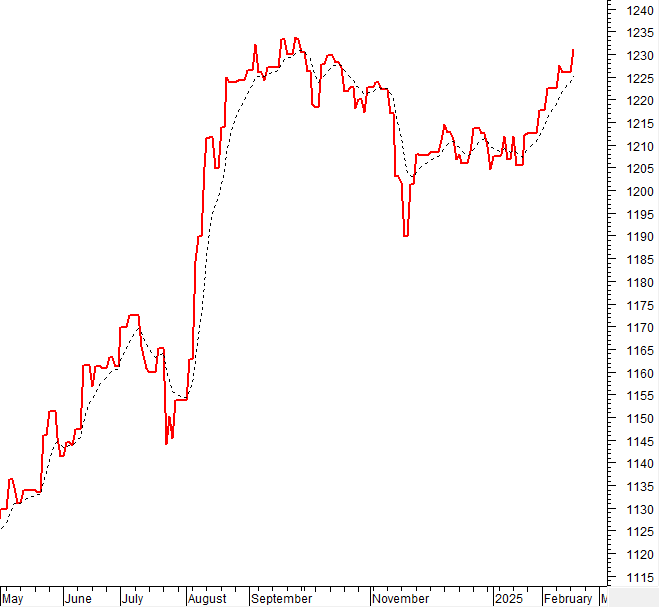
The VN-Index’s upward momentum narrowed as the trading volume remained above the 20-day average. This indicates that strong selling pressure persists as the index retests the old peak from December 2024 (equivalent to the 1,270-1,285-point range). If this trend continues in the coming sessions, the likelihood of breaking through this range will not be high. Currently, the Stochastic Oscillator indicator is moving deep into the overbought zone. If a sell signal reappears and the indicator falls out of this zone, the risk of a downward correction will increase.
II. TREND AND PRICE MOVEMENT ANALYSIS
VN-Index – Stochastic Oscillator Indicator Moving Deep into the Overbought Zone
The VN-Index’s upward momentum narrowed as the trading volume remained above the 20-day average. This suggests that strong selling pressure exists as the index retests the December 2024 peak (1,270-1,285-point range). If this trend persists in the upcoming sessions, breaking through this range is unlikely.
Presently, the Stochastic Oscillator indicator is moving deep into the overbought zone. This indicates an increased risk of short-term corrections if a sell signal reappears.
HNX-Index – Retesting the Old Peaks from September and October 2024
The HNX-Index maintained its positive momentum and closely followed the Upper Band of the Bollinger Bands, reflecting investors’ optimistic sentiment. Currently, the index is retesting the old peaks from September and October 2024 (234-238-point range). If, in the upcoming sessions, the index holds above this range with the trading volume remaining above the 20-day average, the upward trend will be further reinforced.
However, the Stochastic Oscillator indicator is moving deep into the overbought zone. If a sell signal reappears and the indicator falls out of this zone, the risk of a downward correction will increase.
Analysis of Capital Flows
Changes in Smart Money Flows: The Negative Volume Index indicator of the VN-Index has cut above the EMA 20-day line. If this trend persists in the next session, the risk of an unexpected downturn (thrust down) will be limited.
Changes in Foreign Capital Flows: Foreign investors continued to net sell during the trading session on February 18, 2025. If this trend continues in the coming sessions, the outlook will be less optimistic.
III. MARKET STATISTICS FOR FEBRUARY 18, 2025
Economy and Market Strategy Analysis Department, Vietstock Consulting
– 17:17 18/02/2025
The Vietstock Daily: A Glimmer of Hope for the Short-Term Outlook

The VN-Index rebounded after a previous sharp decline, with trading volume remaining above the 20-day average. This indicates that investors are still actively trading. However, selling pressure at the old peak in December 2024 (corresponding to the 1,270-1,280-point range) remains strong. To sustain the upward momentum, the index needs to surpass this range. Currently, the MACD indicator is still showing a buy signal and is above the zero threshold. If this condition persists in the coming period, risks will be mitigated.
The Cautious Mindset Returns

The VN-Index retreated with below-average trading volume, indicating investor caution as the index nears its December 2024 peak (1,270-1,280 points). Additionally, the Stochastic Oscillator has signaled a sell-off in overbought territory, suggesting heightened short-term adjustment risks if the indicator falls from these levels.
The Power of Persuasive Writing: Crafting a Compelling Headline
“Vietstock Weekly: Upholding the Uptrend”

The VN-Index continued its upward trajectory, marking three consecutive weeks of gains since crossing above the 200-week SMA. Accompanying this rise is a surge in trading volume, which has exceeded the 20-week average since mid-November 2024. This indicates a positive shift in market participation. At present, the MACD indicator has just triggered a buy signal, crossing above the signal line. Should this momentum be sustained, the short-term outlook remains optimistic.
The Ultimate Headline: VN-Index: Navigating the Crucial Test Ahead

The VN-Index surged, closely hugging the upper band of the Bollinger Bands, reflecting a highly optimistic investor sentiment. The index has surpassed its previous peak of 1270-1285 points from December 2024 and is now approaching the crucial resistance level of 1300 points. A breakthrough above this level would further enhance the positive outlook. However, the Stochastic Oscillator indicator is venturing deep into overbought territory. Investors are advised to exercise caution in the coming period, as a potential sell signal from the indicator could trigger a shift in market dynamics.
Market Beat: VN-Index Plunges, Steel Stocks Take a Hit on News of Tariffs

The market closed with notable losses, as the VN-Index dipped by 11.94 points (-0.94%) to close at 1,263.26, while the HNX-Index fell by 1.52 points (-0.66%), settling at 227.97. The market breadth was overwhelmingly bearish, with 489 declining stocks outweighing 270 advancing stocks. Within the large-cap VN30 basket, bears held the edge, as evidenced by 16 tickers in the red versus 9 in the green, while 5 remained unchanged.


