


: The Short-Term Tug-of-War")


: Navigating the FOMO Trap and ‘Off-Island’ Entries”")


I. VIETNAM STOCK MARKET WEEK 17-21/02/2025
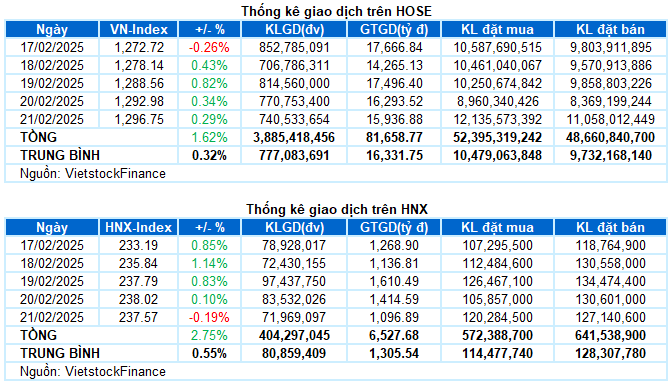
Trading: At the end of the trading session on February 21st, the VN-Index slightly increased by 0.29% from the previous session, reaching 1,296.75 points; while the HNX-Index ended its gaining streak with a decrease of 0.19%, settling at 237.57 points. For the whole week, the VN-Index gained a total of 20.67 points (+1.62%), and the HNX-Index rose by 6.35 points (+2.75%).
The Vietnamese stock market maintained its positive trend with 4 out of 5 gaining sessions last week. Active cash flow continued to seek opportunities in small and medium-cap stocks, while large-cap stocks played a supportive role, helping the VN-Index approach the historical peak of 1,300 points. However, the hesitant sentiment was also quite evident in the last two sessions as the index neared this resistance level. The VN-Index ended the week at the 1,296.75-point threshold.
In terms of impact, VCB was the main pillar supporting the market today, contributing nearly 2 points to the gain. In addition, CTG, BCM, and MWG also added 2 points, helping the index maintain its green status in the final session of the week. On the other hand, there was no particular stock that exerted significant pressure, with FPT being the most negatively influential stock, but it only took away less than half a point from the VN-Index.
The red color prevailed when considering the sector indices. Information Technology and Energy were the two sectors at the bottom of the table, with a decrease of around 0.7%. This was mainly due to the adjustment pressure from FPT (-0.7%), CMG (-0.45%); BSR (-0.49%), PVD (-1.03%), PVS (-0.58%), PVC (-1.75%), and PVB (-1.42%).
In contrast, the Non-essential Consumer Goods and Financials sectors maintained their green status quite well, with notable contributions from MWG (+2.47%), GEE (+2.82%), TLG (+3.13%), PRT (+6.36%); VCB (+1.53%), CTG (+1.59%), VPB (+1.3%), and BVH (+1.93%). Nevertheless, many stocks still faced adjustment pressure, typically FRT (-2.39%), DRC (-1.03%), MSH (-0.49%); EIB (-1.22%), TPB (-0.58%), NVB (-1.72%), SHS (-1.39%), MBS (-1.04%), etc.
The remaining sectors showed clear differentiation, as most sector indices fluctuated around the reference level with a low amplitude.
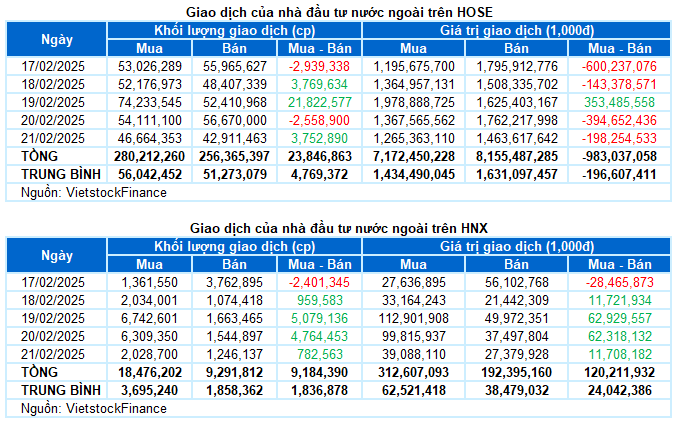
Foreign investors maintained their net selling position with a value of nearly VND 863 billion on both exchanges last week. Specifically, they net sold over VND 983 billion on the HOSE and net bought more than VND 120 billion on the HNX.
Trading value of foreign investors on HOSE, HNX, and UPCOM by day. Unit: VND billion

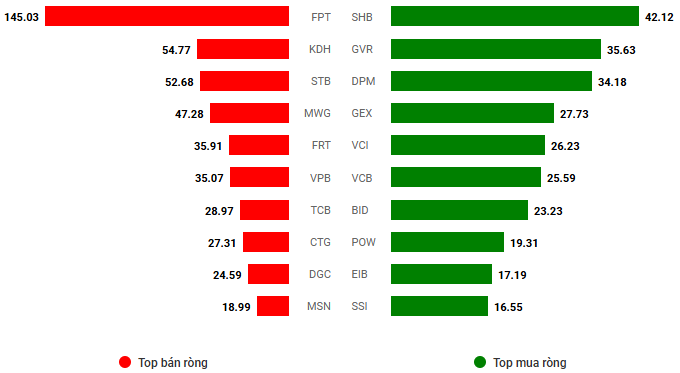
Net trading value by stock ticker. Unit: VND billion
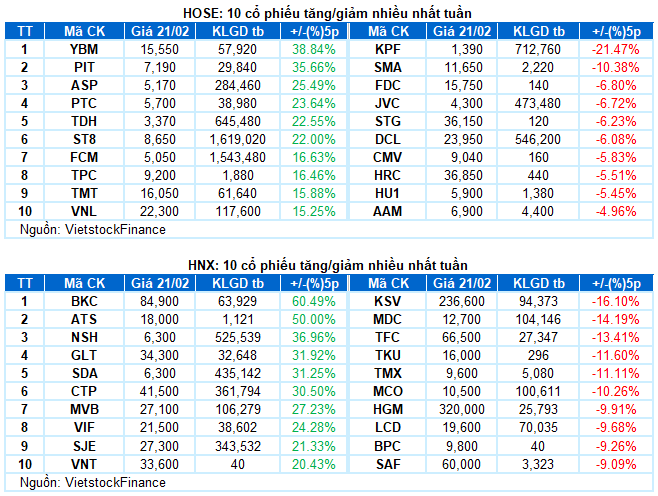
Stocks with significant increases last week: YBM
YBM rose by 38.84%: YBM witnessed a vibrant trading week, surging by 38.84%. The stock continuously soared with the emergence of a Rising Window candlestick pattern. Moreover, the trading volume remained above the 20-day average, indicating very active participation from cash flow.
However, the Stochastic Oscillator indicator is now deep into the overbought zone and may soon signal a sell-off. If this occurs, the risk of adjustment will increase.
Stocks with significant decreases last week: KPF
KPF fell by 21.47%: KPF experienced a negative trading week, recording losses in 4 out of 5 sessions, with the appearance of Black Marubozu and Falling Window candlestick patterns. Additionally, the trading volume consistently remained above the 20-day average, signifying strong selling pressure on this stock.
At present, the Stochastic Oscillator indicator continues to decline after giving a sell signal, and the MACD indicator provides a similar signal, even cutting below the zero line. This suggests that the short-term adjustment risk remains.
II. STOCK MARKET STATISTICS FOR LAST WEEK
Economics & Market Strategy Division, Vietstock Consulting
– 16:59 21/02/2025
The Stock Market Week of February 10-14, 2025: Foreign Investors Continue Their Selling Spree

The VN-Index concluded a week of volatile trading with a modest gain. The index currently hovers above the 200-day SMA, and trading volume exhibits positive signs of improvement. This indicates a vibrant and active trading environment. However, the prolonged foreign selling streak could hinder the index’s growth trajectory in the coming period.
The Market Tug-of-War: Can the Bulls Break Free?

The VN-Index retreated, continuing its volatile movement as it retested the old peak of December 2024 (1,270-1,285 points). This threshold has proven to be a significant resistance level, as the index has repeatedly tested this zone recently. Presently, the Stochastic Oscillator is venturing deep into overbought territory. Should a sell signal emerge and the index falls out of this zone, the risk of a correction heightens in upcoming sessions.
Market Beat: A Tale of Contrasting Headlines and Cautious Sentiment

The market closed with the VN-Index down 1.54 points (-0.12%) to 1,266.91, while the HNX-Index climbed 0.45 points (+0.2%) to 229.32. The market breadth tilted towards gainers with 349 advancing stocks against 375 declining ones. The large-cap basket, VN30-Index, witnessed a similar performance with 14 losers, 11 gainers, and 5 stocks closing flat, indicating a relatively balanced session.
The Market Beat on Valentine’s Day: Finance Sector Falters but VN-Index Stays in the Green

The market ended the session on a positive note, with the VN-Index climbing 5.73 points (+0.45%) to reach 1,276.08, while the HNX-Index rose 1.7 points (+0.74%) to close at 231.22. The market breadth tilted in favor of gainers, with 473 advancing stocks against 300 decliners. The large-cap sector painted a bullish picture, as evidenced by the VN30 basket, which witnessed 16 gainers, 8 losers, and 6 stocks ending unchanged, favoring the bulls.
Market Beat: Foreigners Turn Net Buyers, VN-Index Surges Over 10 Points

The market closed with strong gains, seeing the VN-Index climb by 10.42 points (+0.82%), settling at 1,288.56; while the HNX-Index rose by 1.95 points (+0.83%) to close at 237.79. The market breadth tilted in favor of bulls with 532 gainers versus 250 decliners. The large-cap stocks in the VN30 basket painted a predominantly green picture, with 26 tickers in the green, 3 in the red, and 1 unchanged.


