
I. VIETNAM STOCK MARKET WEEK 19-23/05/2025
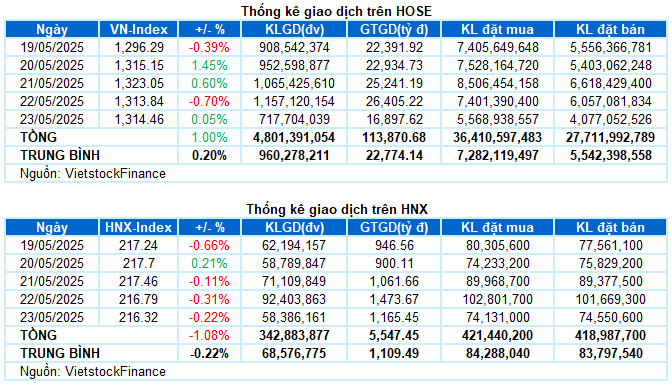
Trading: At the end of the 23/05 session, the VN-Index regained its green color, ending the week at 1,314.46 points, up slightly by 0.05% from the previous session. Meanwhile, the HNX-Index decreased by 0.22%, falling back to 216.32 points. For the whole week, the VN-Index gained a total of 13.07 points (+1%), while the HNX-Index lost 2.37 points (-1.08%).
The Vietnamese stock market experienced a rather volatile trading week. After losing the 1,300-point mark at the beginning of the week, the VN-Index quickly rebounded strongly in the next two sessions, led by large-cap stocks. However, the upward momentum faced significant profit-taking pressure as the index approached the resistance area around the 1,330-point level. The last session of the week closed with a clear divergence among stock groups. The VN-Index ended the week at the 1,314.46 level, up 1% from the previous week.
In terms of impact, GAS, VHM, and GEE contributed the most to keeping the VN-Index in the green in the last session, bringing in 2.2 points. Meanwhile, VPL, TCB, and VPB exerted the most considerable pressure, causing the index to lose 1.5 points.
Most sectors fluctuated within a narrow range. Only the industrial group led the market with a significant increase of over 1%, thanks to the outstanding performance of stocks such as ACV (+3.33%), HAH (+3.81%), DPG (+1.48%), VEA (+1.82%), TV2 (+1.3%), TOS (+4.47%), and VNE (+6.81%).
Although the utilities group ranked second with a 0.86% increase, this figure was mainly contributed by the industry’s largest market cap stock, GAS (+3.28%). The remaining stocks in the industry rose and fell interchangeably, with the red hue slightly higher, with many stocks losing more than 1%, such as POW, VSH, SBH, NT2, GEG, and BTP.
On the downside, essential consumption, financial, and non-essential consumption groups ended the day in the red on the last day of the week. This was mainly influenced by the adjustment of MCH (-1.32%), MSN (-1.25%), VHC (-0.94%); TCB (-1.15%), VPB (-1.09%); VPL (-1.85%), PLX (-1.29%), and DGW (-1.99%). However, the overall picture was not too negative as these groups still recorded some notable bright spots, such as HAG (+4.94%), DBC (+1.09%), PAN (+6.09%); EIB (+1.42%), STB (+1.7%), ACB (+1.17%); HHS (+4.12%), TLG (+2.74%), MSH (+5.34%), GEX (+5.31%), and GEE and PAC hitting the ceiling price.
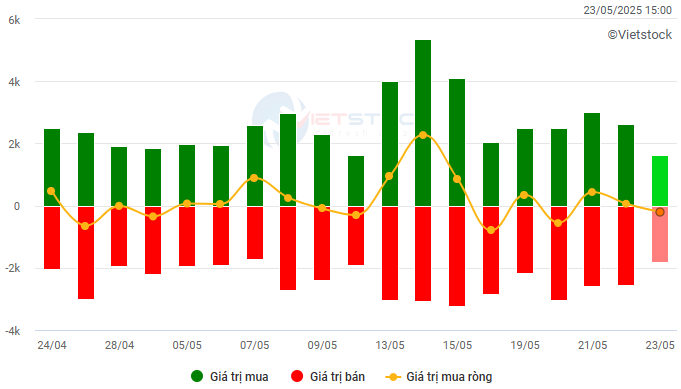
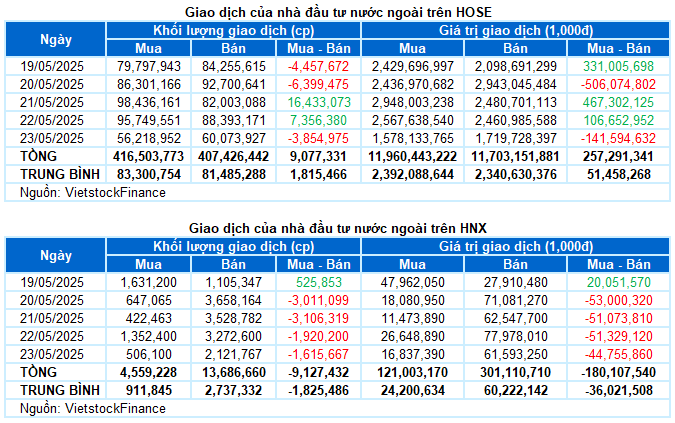
Foreign investors net bought over VND 77 billion on both exchanges this week. Specifically, foreign investors net bought over VND 257 billion on the HOSE and net sold over VND 180 billion on the HNX.
Trading value of foreign investors on HOSE, HNX, and UPCOM by day. Unit: VND billion
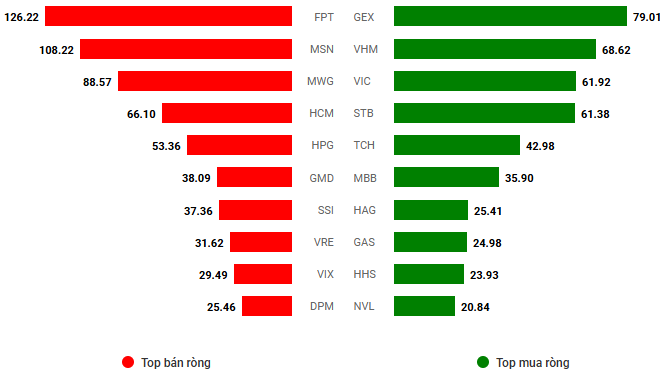
Net trading value by stock code. Unit: VND billion
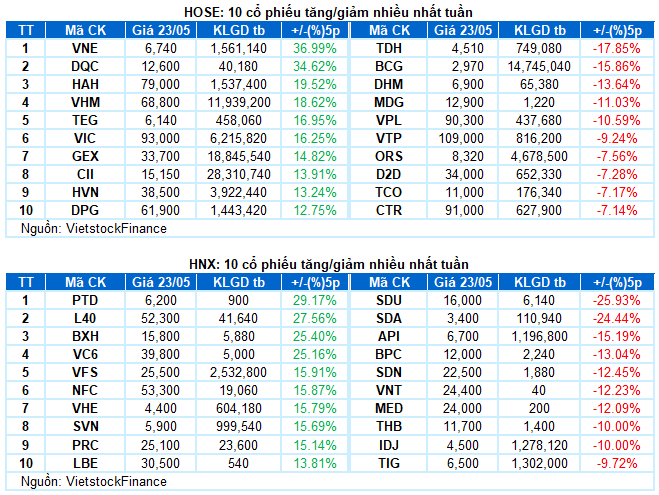
Stocks with significant increases this week: VNE
VNE up 36.99%: VNE continued to have a brilliant trading week with a gain of 36.99%. The stock has continuously surged strongly while closely following the Upper Band of the Bollinger Bands. Additionally, the trading volume has been above the 20-day average, indicating strong participation from investors. If this positive momentum persists, the VNE stock is likely to conquer the next peak formed in November 2023 (corresponding to the 6,880-7,320 range).
However, the Stochastic Oscillator indicator is deeply embedded in the overbought zone. Investors should exercise caution in their investment decisions if this indicator triggers a sell signal.
Stocks with significant decreases this week: TDH
TDH down 17.85%: TDH stock faced considerable selling pressure this week, with 4 out of 5 sessions ending in sharp declines. If, in the coming sessions, the TDH stock drops below the Middle line of the Bollinger Bands, the situation will become even more pessimistic.
Currently, the Stochastic Oscillator indicator continues to decline after triggering a sell signal. Additionally, the MACD indicator gives a similar signal. This suggests that the short-term correction risk remains.
II. STOCK MARKET STATISTICS FOR THE PAST WEEK
Economics & Market Strategy Division, Vietstock Consulting Department
– 17:20 23/05/2025
Technical Analysis for May 21: Deciphering Market Polarization

The VN-Index and HNX-Index exhibited a contrasting performance amid a weakening ADX indicator, hinting at a potential sideways trend with interspersed gains and losses in upcoming sessions.
What are the Strongest Stocks on the VN-Index?

As of late May 2025, the VN-Index has climbed approximately 4.44% since the start of the year, weathering the April slump triggered by tariff headlines. Yet, not all investors’ portfolios are in the green.
Chasing the Money Trail: Foreign Investors Sell Off FPT Shares, While MWG Attracts Major Interest

“On May 22nd, FPT took the lead in foreign investors’ selling spree. Meanwhile, MWG grabbed the spotlight as it witnessed a dichotomy of flows, with proprietary traders offloading their holdings, but foreign investors accumulating a net purchase of over 134 billion VND.”
Market Beat: VN-Index Holds on to Green, VHM Soars to New Heights

The market closed with the VN-Index up 7.9 points (+0.6%), reaching 1,323.05; while the HNX-Index fell 0.24 points (-0.11%) to 217.46. The market breadth tilted towards decliners, with 397 losers and 337 gainers. The VN30 basket saw a relatively balanced performance, as 13 stocks added value, 12 declined, and 5 remained unchanged.
Market Beat: Profit-Taking Pressures Mount, VN-Index Back to Square One.

The morning session witnessed a cooling of large caps and widespread profit-taking pressures, pulling the VN-Index back towards the reference level. By the mid-session break, the VN-Index had gained just under 1 point, hovering at 1,316.13; while the HNX-Index underwent a more pronounced correction, shedding 0.59% to stand at 216.42. Market breadth was negative with 422 decliners overpowering 227 advancers.


