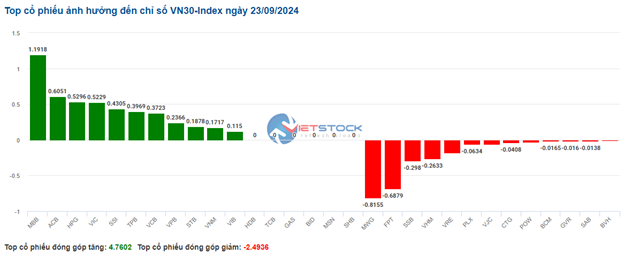
Market Beat: Selling Pressure Persists
The market closed with the VN-Index down 3.56 points (-0.2%), settling at 1,268.48. The HNX-Index also witnessed a decline of 0.92 points (-0.39%), ending the day at 233.38. Bears dominated the market breadth, with 432 declining stocks outweighing 281 advancing ones. Within the VN30-Index basket, red prevailed as 17 stocks lost ground, opposed by 11 gainers and 2 unchanged stocks.
The Market Beat: A Rapid Decline, A Strong Surge in the Expiry of Derivatives
The VN-Index faced pressure throughout the morning session and the early minutes of the afternoon, dipping below 1,272 points. However, true to the nature of an expiration day for derivatives, the VN-Index staged a strong comeback, closing above 1,286 points. This impressive turnaround was largely driven by the banking, securities, and real estate sectors, which provided the much-needed boost to push the index higher.
Vietstock Weekly 14-18/10/2024: Aiming for July 2024 Highs
The VN-Index rallied and staged a strong recovery last week after retesting the middle line of the Bollinger Bands. However, trading volume fell below the 20-week average, indicating that investors are becoming cautious again. In the coming week, the index has the opportunity to target the old peak of July 2024 (corresponding to the 1,290-1,300 point range). If the index can surpass this crucial threshold, we may see a more positive outlook emerge.
Market Beat: Buyers Return in Afternoon Trade, VN-Index Surges Over 9 Points
The market ended the session on a positive note, with the VN-Index climbing 9.87 points (0.78%) to reach 1,281.85, while the HNX-Index gained 0.25 points (0.11%), closing at 231.77. The market breadth tilted in favor of the bulls, as evident from the advance-decline ratio of 411:256. A similar trend was observed in the VN30 basket, with 22 stocks advancing, 6 declining, and 1 remaining unchanged, resulting in a sea of green on the screen.
The Market Pulse: The Crucial 1,300-Point Threshold
The VN-Index retreated to close a week of volatile trading. Investor caution persisted as trading volume remained below the 20-week average. Additionally, the index continued to struggle as it approached the September 2024 high (1,290-1,300 points range). If the index recovers with improved liquidity in the coming phase, it is highly likely to surpass this range.
The Market Beat: The Tug-of-War Continues
As of the market close, the VN-Index dipped 1.06 points (-0.08%), settling at 1,285.46, while the HNX-Index witnessed a decline of 0.91 points (-0.4%), closing at 229.21. The market breadth tilted towards decliners, with 364 stocks falling against 315 advancing stocks. The VN30-Index basket saw a relatively balanced performance, with 13 stocks in the red, 12 in the green, and 5 unchanged.
The Market Beat: Selling Pressure Mounts, VN-Index Dips into the Red
The market closed with the VN-Index down 5.69 points (-0.44%) to 1,279.77 and the HNX-Index down 1.78 points (-0.78%) to 227.43. The market breadth tilted towards decliners with 473 losers and 228 gainers. The large-cap stocks in the VN30-Index basket painted a similar picture, with 23 stocks declining, 5 advancing, and 2 unchanged.
The Market Beat 24/10: Another Day, Another Dive
The market on October 24th delivered a somber day for investors as it witnessed a continuous decline, especially during the afternoon session, ending with a deep slump. A sea of red engulfed the market, with the spotlight on the banking and real estate sectors, dragging down the overall sentiment.
The Rising Pessimism
The VN-Index witnessed a significant decline, forming a bearish Black Marubozu candlestick pattern and breaching the middle line of the Bollinger Bands. The MACD and Stochastic Oscillator indicators continue on a downward trajectory, reinforcing the sell signal. Moreover, persistent foreign net selling sends a cautious message to investors about the market's outlook in the near term.
The Ultimate Headline: “Warning Signs: Are Negative Signals Brewing?”
The VN-Index witnessed a significant decline, forming a Black Marubozu candlestick pattern and breaking below the previous low from early October 2024 (around the 1,265-1,270 point level). This strong bearish move reflects the prevailing pessimistic sentiment among investors. Moreover, the trading volume remains below the 20-day average, indicating that buying interest is still limited. The MACD indicator continues to flash a sell signal and has dropped below zero, suggesting that the downward trend is likely to persist in the near term.


