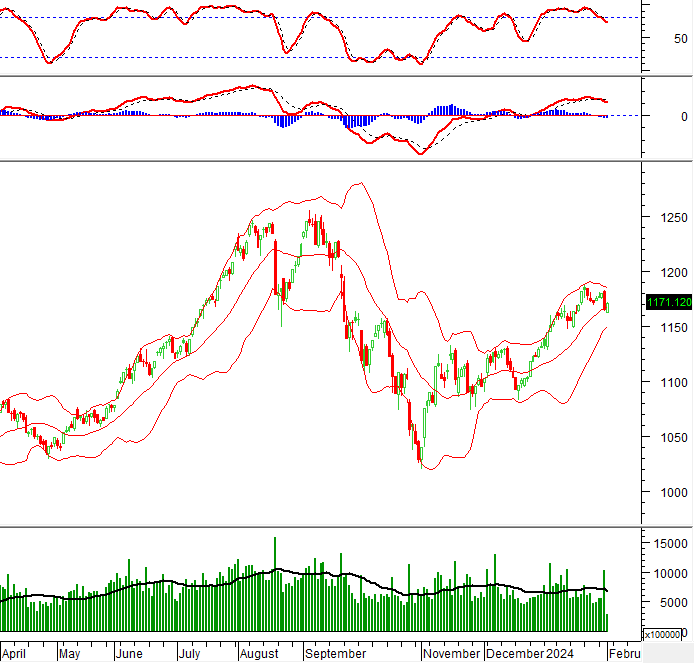
The Technical Signals of VN-Index
In the morning trading session on 01/02/2024, VN-Index showed a positive momentum and crossed above the Middle line of Bollinger Bands.
However, the volume decreased and is expected to be below the 20-day average at the end of the trading session. This indicates that investors are being cautious.
In addition, the Stochastic Oscillator and MACD indicators have not given positive signals yet. This demonstrates that there is still a risk of correction.
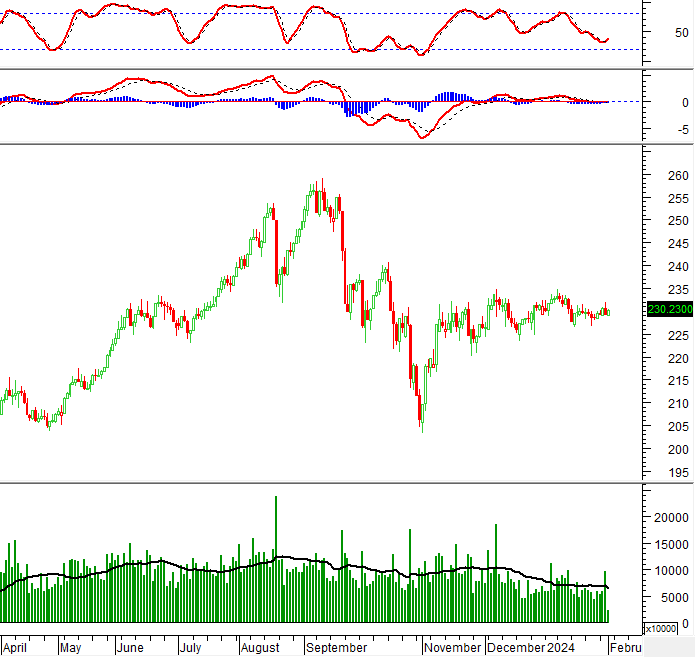
The Technical Signals of HNX-Index
In the trading session on 01/02/2024, HNX-Index increased and there were alternating green and red candles in recent sessions, indicating investors’ hesitation.
However, the MACD indicator is trending up and has the potential to cross above the 0 level in the near future. If there is a buy signal, the short-term outlook will be more optimistic.
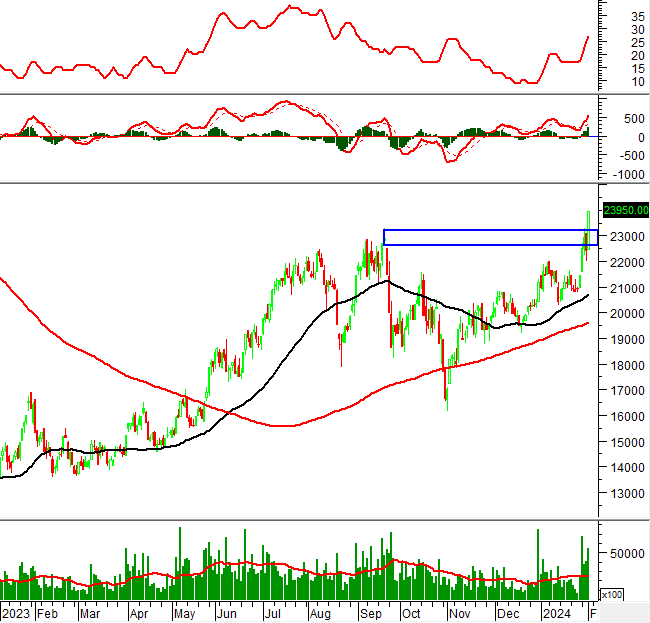
GVR – Vietnam Rubber Industry Group – Joint Stock Company
In the morning trading session on 01/02/2024, GVR stock hit the trading limit up and formed a White Marubozu candle pattern with volume exceeding the 20-day average. This indicates that investors are very optimistic.
In addition, the MACD indicator continues to trend up after giving a buy signal, showing positive prospects in the future.
Currently, GVR has surpassed the previous peak in September 2023 (equivalent to the range of 22,600-23,200). This will be a strong support level for GVR in the future.
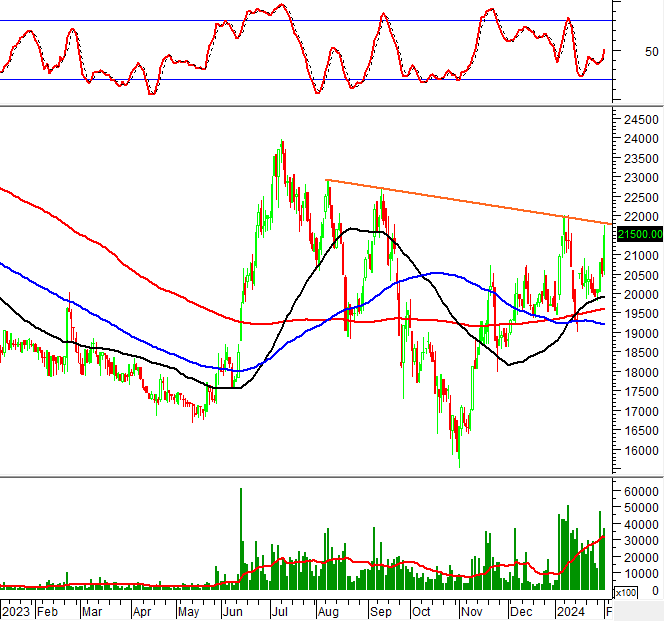
VSC – Vietnam Container Corporation
In the morning session on 01/02/2024, VSC stock rose sharply and formed a long-bodied candle after the Golden Cross signal between the 50-day SMA and the 100-day SMA, as well as the 200-day SMA. This indicates positive long-term prospects.
In addition, the Stochastic Oscillator has given a buy signal and is trending up, suggesting that the upward trend is likely to continue.
Currently, the price of VSC stock is approaching the Neckline (equivalent to the range of 21,600-22,000) of the Inverse Head and Shoulders pattern. If the upward momentum is maintained and breaks above this line, the potential price target is the range of 28,200-29,500.
Technical Analysis Department, Vietstock Advisory Office


