


Technical signals of VN-Index
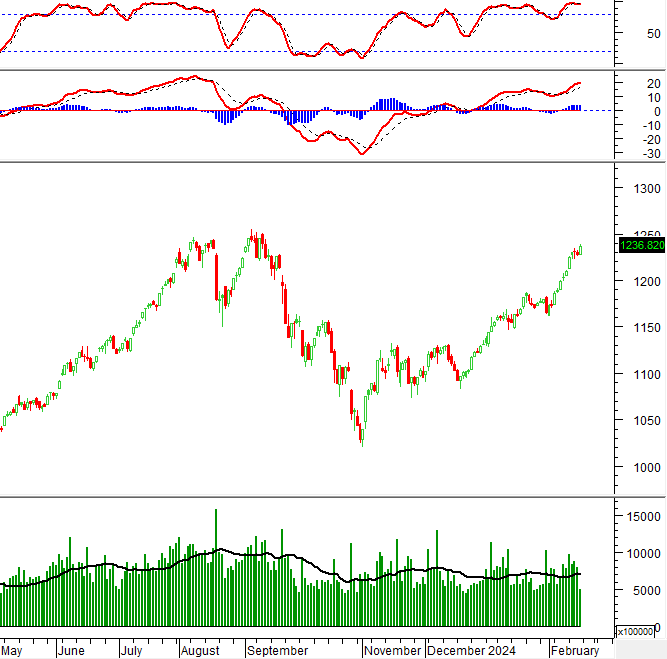
In the trading session of February 23, 2024, VN-Index increased points and is approaching the old peak in September 2023 (equivalent to the range of 1,240-1,255 points) with high trading volume. It is expected to exceed the 20-day average when the session ends, indicating the optimistic sentiment of investors.
However, the Stochastic Oscillator indicator has given a sell signal in the overbought zone. This indicates that there will be a short-term adjustment risk if the indicator falls out of this zone.
Technical signals of HNX-Index
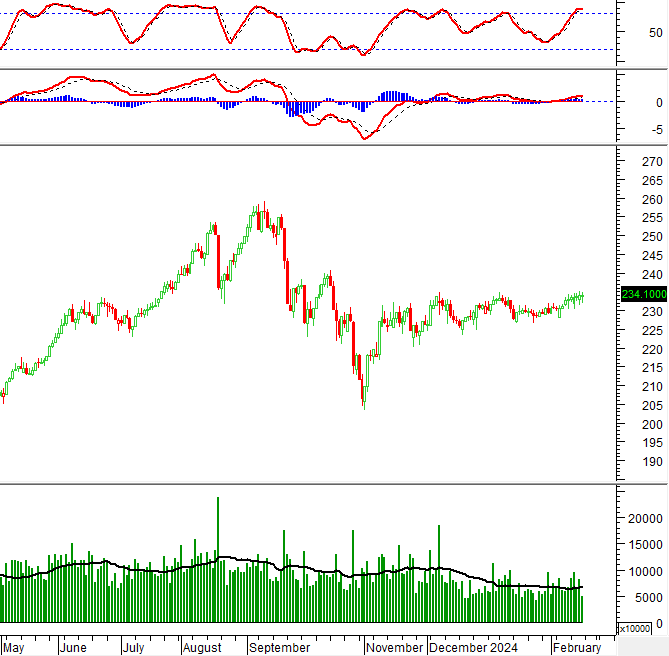
In the trading session of February 23, 2024, HNX-Index slightly increased and continued to maintain the upward momentum for the past two weeks.
However, the Stochastic Oscillator indicator has entered the overbought zone. If a sell signal appears, the short-term outlook will be pessimistic.
TCB – Techcombank
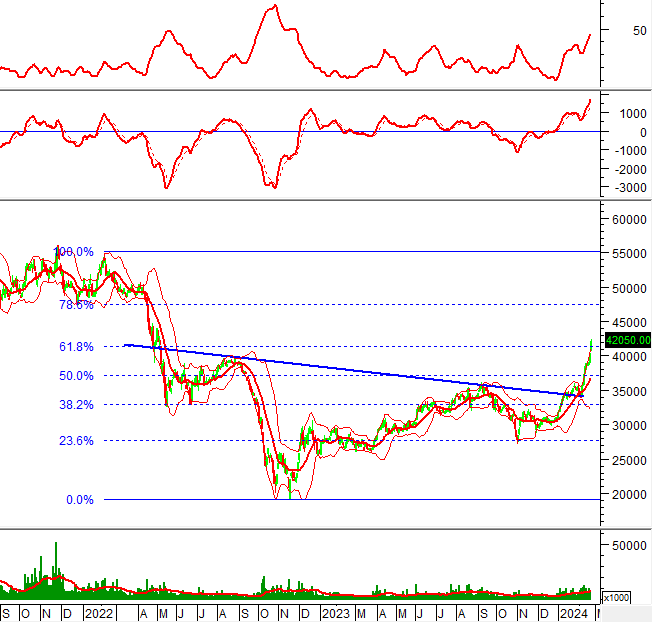
In the morning session of February 23, 2024, the stock TCB surged strongly while forming a Rising Window candlestick pattern, accompanied by trading volume surpassing the 20-day average, indicating a very optimistic investor sentiment.
In addition, the price of TCB has reached a new 52-week high and continues to closely follow the Upper Band of the Bollinger Bands, while the ADX has been continuously increasing since January 2024 with a reading above 30, indicating a strong upward trend.
After successfully breaking the Neckline of the Inverse Head and Shoulders pattern, if the price of TCB surpasses the Fibonacci Retracement 78.6% level (equivalent to the range of 46,800-47,800) in the near future, there is a high possibility to achieve the price target range of 53,500-54,500.
VHC – Vingroup
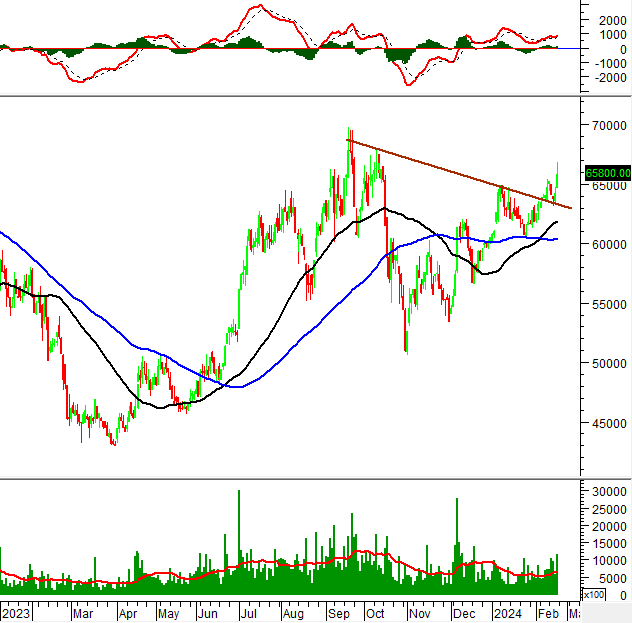
In the morning trading session of February 23, 2024, VHC increased and continuously formed higher highs and higher lows after the Golden Cross between the 50-day SMA and 100-day SMA, indicating a bullish trend has formed.
The trading volume has been consistently improving in recent sessions and surpassing the 20-day average, indicating active trading by investors.
Currently, the price of VHC has successfully broken and throwbacked the Neckline of the Inverse Head and Shoulders pattern, and the potential price target range in the near future is 79,000-81,000.
Technical Analysis Department, Vietstock Advisory Team


