BTC: Golden Cross signal appears on the Weekly timeframe
In the weekly chart, BTC has shown strong upward momentum and consistently stayed close to the upper band of the expanding Bollinger Bands, indicating a very optimistic outlook.
In addition, a Golden Cross signal has appeared between the weekly SMA 50 and SMA 100 lines while the price is testing the March 2022 high (equivalent to the range of 44,200 – 48,200), and the ADX continues to rise (ADX is above the 25 level). If the upward trend continues, the possibility of breaking above this high range is quite high.
Currently, the Fibonacci Projection 100% level (equivalent to the range of 40,300 – 42,400 points) has been broken and will now serve as a strong support. The next target is the range of 49,400 – 52,000 points (equivalent to the Fibonacci Projection 161.8% level).
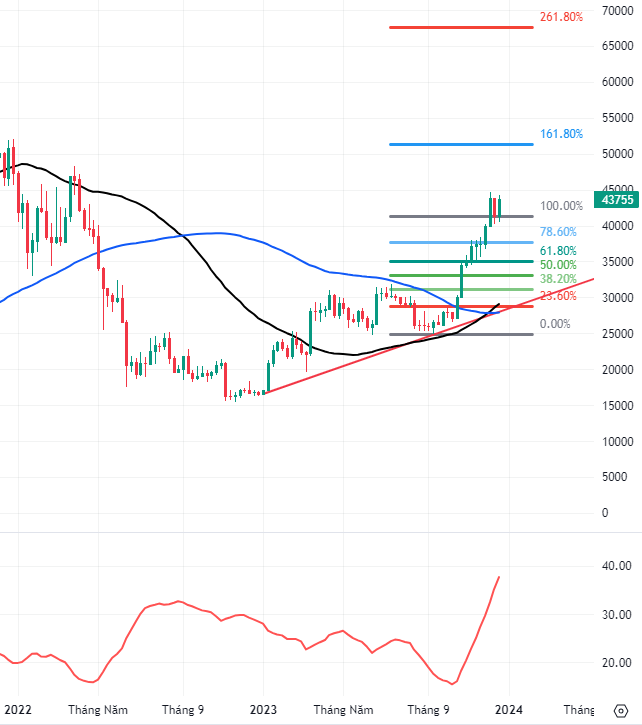
BTC chart in the 2022-2023 period – Source: TradingView
ETH: Stochastic Oscillator gives a sell signal
From June 2022 until now, ETH has continued to move within a wide range in a bullish price channel.
In addition, according to the weekly chart, the Stochastic Oscillator has given a sell signal in the overbought zone. If the indicator falls into this zone in the near future, the risk will increase even more.
Furthermore, the price of ETH has crossed above both the weekly SMA 50 and SMA 100 lines, so it will receive support from this SMA group if the corrective phase continues.
The writer expects that the correction process of ETH will continue in the near future. Therefore, investors should be cautious when trading at this price range.
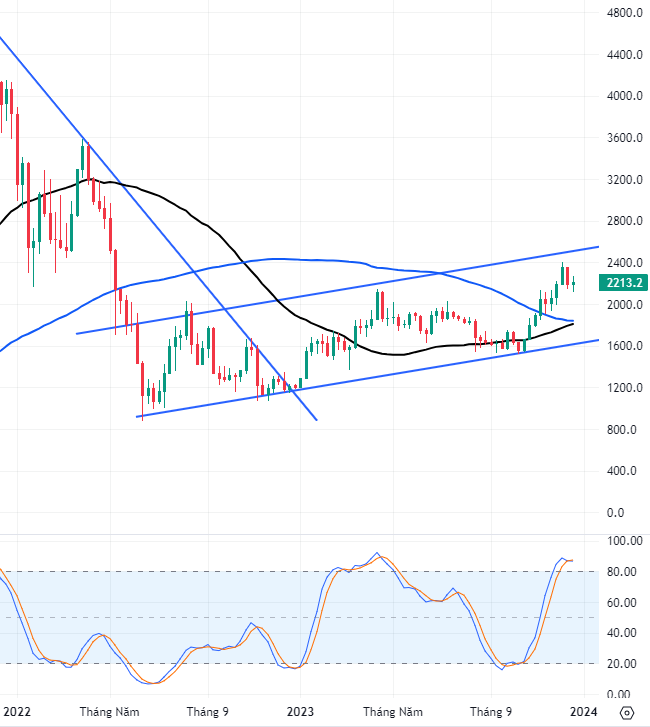
ETH chart in the 2022-2023 period – Source: TradingView
Technical Analysis Department, Vietstock Advisory Department


