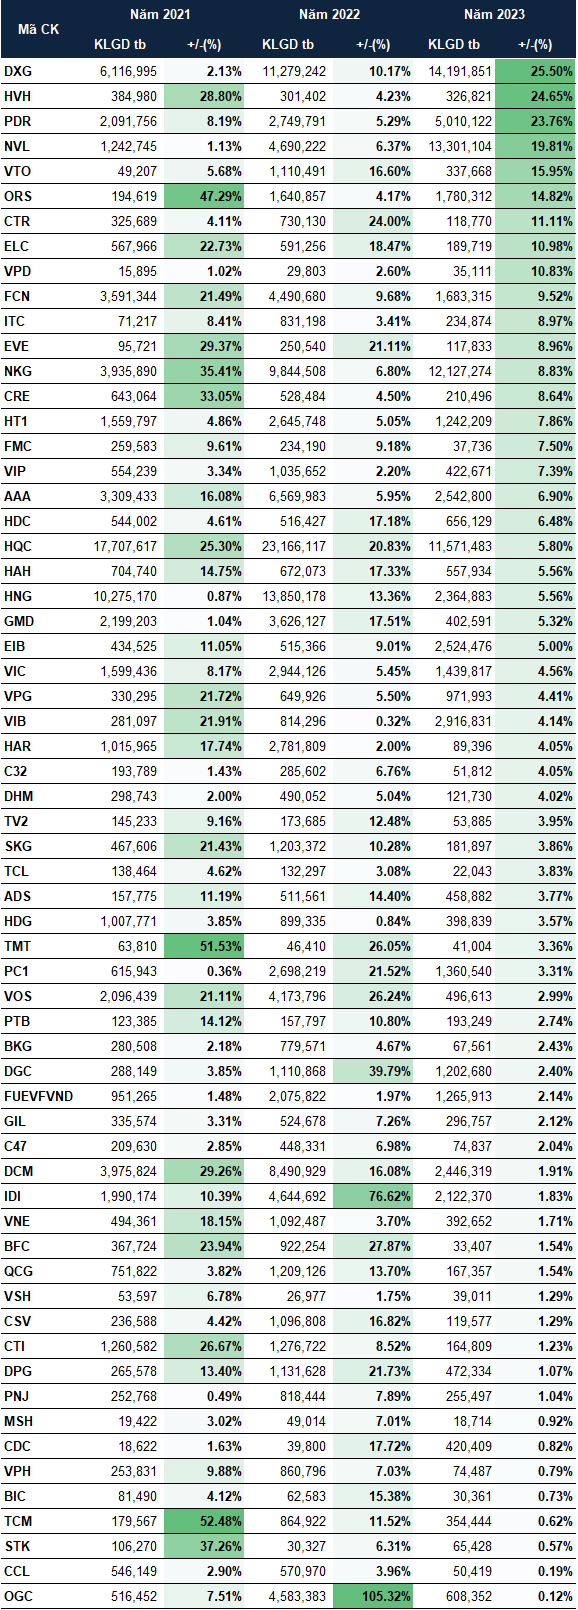
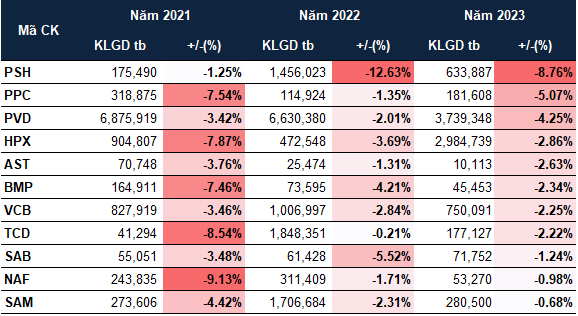
According to statistics from VietstockFinance, in March the 3rd consecutive year 2021-2023 phase, HOSE recorded 62 stocks that consistently increased, while there were 11 stocks that consistently decreased.
Most of the stocks that usually increased during this period were mid and small-cap stocks, except for real estate giants like VIC, NVL, PDR, DXG.
On the other hand, other leading companies such as VCB, BMP, SAB all appeared in the decreasing group.
|
Stocks on HOSE increased in the whole March 2021-2023 period
Source: VietstockFinance
|
|
Stocks on HOSE decreased in the whole March 2021-2023 period
Source: VietstockFinance
|
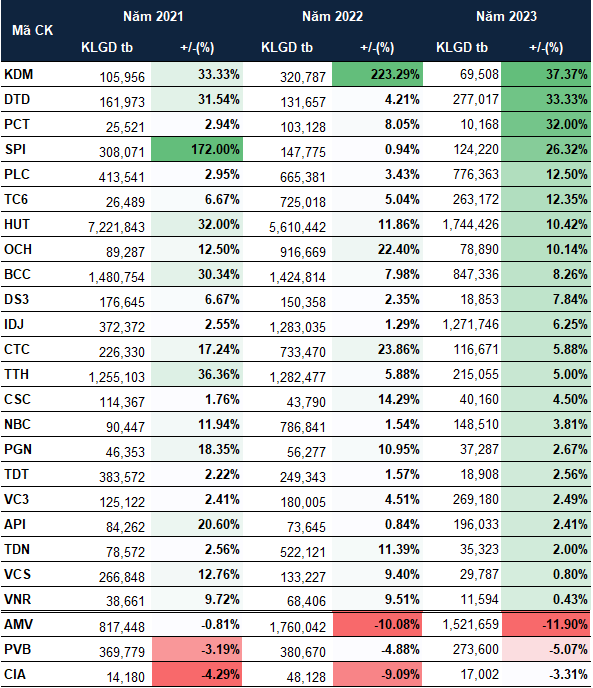
At HNX, the number of stocks that usually increased also dominated over the number of stocks that usually decreased. While there were only 3 stocks that decreased, which are AMV, PVB, and CIA, there were up to 22 stocks that usually increased. Some familiar stocks in the increasing group for investors can be mentioned as PLC, HUT, OCH,…
|
Stocks on HNX increased/decreased in the whole March 2021-2023 period
Source: VietstockFinance
|
Not only did the number of stocks that usually increased dominate, most of VN-Index also showed positive signs in March. Data over the past decade (2014-2023) showed that VN-Index only decreased in 2 years: 2015 and 2020, and remained unchanged in 2016, while it increased in the rest of the years in this month.
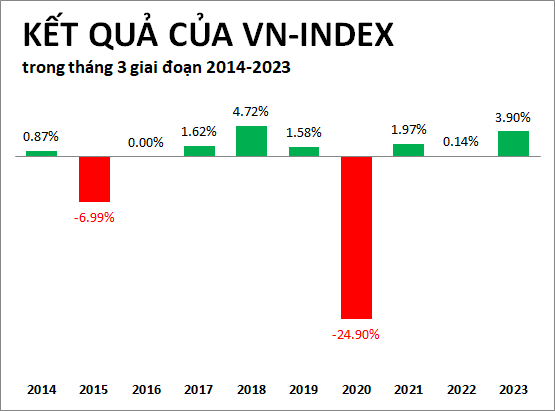 Source: VietstockFinance
|
At the webinar with the theme “Market 2024: Leading Cash Flow and Expert Perspective” on the afternoon of February 22, 2024, Mr. Nguyen Van Quy, Head of Analysis and Investment Advisory Division, Scientific and Technological Department of Ho Chi Minh City Securities Corporation (HOSE: HCM), evaluated that the cash flow potential towards 2024 is still there, through analyzing market psychology indicators, especially considering the number of stock groups surpassing the 50 to 200-day moving average. The indicator reflects the correlation between the strength of cash flow and the breadth of the market, to see investors’ expectations in the medium and long term.
On the other hand, when big wave cash flow shows signs of starting, the banking group usually appears first, then gradually shifts to the Mid Cap group.
HSC expert: Cash flow in 2024 still has room for growth


