


-Based Project Announces Partnership with Google Cloud!")

 Founder Justin Sun Reveals His Top Three Favorite Meme Tokens")
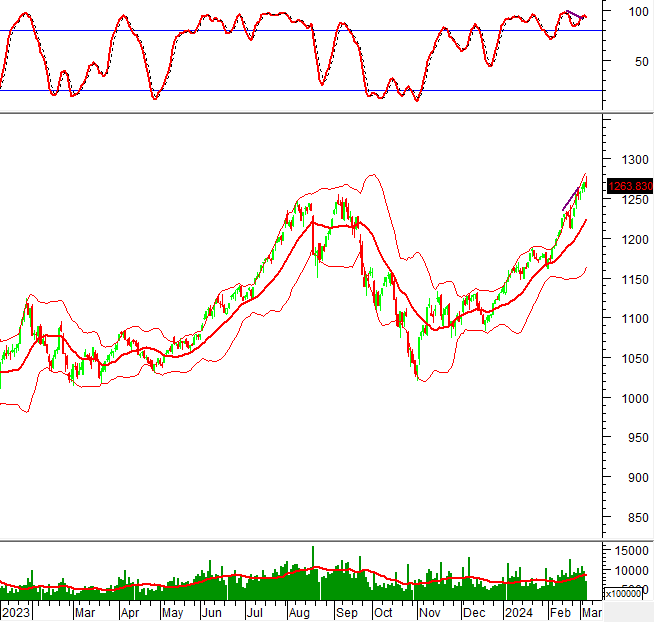
Technical Signals of VN-Index
In the morning trading session on 06/03/2024, VN-Index lost points and at the same time showed a candlestick pattern similar to Inverted Hammer, indicating that selling pressure is still quite high.
The volume in the morning session increased and is expected to exceed the 20-day average when the session ends, indicating that investor sentiment is not very optimistic.
In addition, the Stochastic Oscillator has formed a bearish divergence and has provided a signal to sell back in the overbought zone. The risk of correction will increase when the indicator falls out of this zone.

Technical Signals of HNX-Index
In the trading session on 06/03/2024, HNX-Index lost points with a volume of trading expected to exceed the 20-day average when the session ends, reflecting a rather pessimistic investor sentiment.
On the other hand, the MACD and Signal lines are starting to converge, so the prospects will be less positive when sell signals reappear.

BVS – Bao Viet Securities Joint Stock Company
In the morning trading session on 06/03/2024, the stock price of BVS continued to rise sharply and at the same time showed a candlestick pattern similar to White Marubozu after the appearance of a golden cross signal between the 50-day SMA and the 100-day SMA, indicating the presence of positive prospects.
The volume has been maintained above the 20-day average in recent sessions, indicating that investors are trading actively.
Currently, the stock price of BVS has successfully broken the long-term downtrend trendline in the context of the ADX indicator above 25, indicating that the uptrend has formed.

GAS – Vietnam Gas Corporation
In the morning session on 06/03/2024, GAS stock increased with improved trading volume and exceeded the 20-day average, indicating a relatively optimistic investor sentiment.
In addition, the MACD and Stochastic Oscillator continue to move up after providing buy signals, indicating positive prospects in the coming sessions.
However, the GAS stock price is currently testing the Fibonacci Retracement level of 38.2% (equivalent to the range of 80,800-82,100), so there will be some fluctuations at this level.

Technical Analysis Department, Vietstock Advisory Department


-Based Project Announces Partnership with Google Cloud!")


