Technical Signals of VN-Index
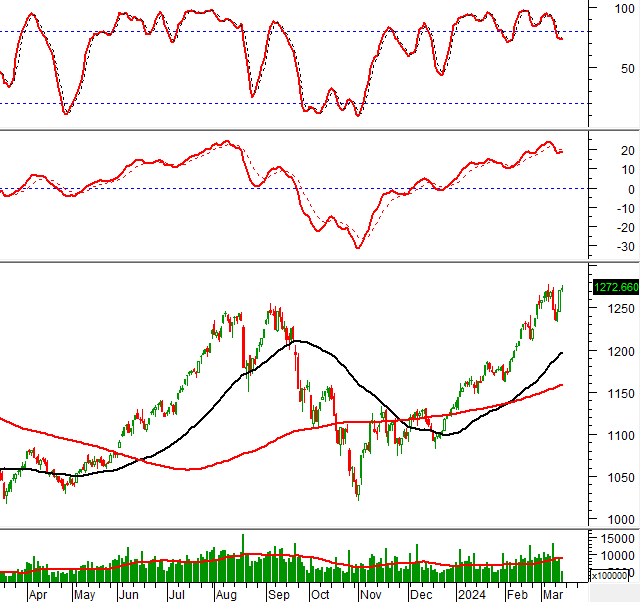
In the morning trading session on March 14, 2024, VN-Index slightly increased while displaying the High Wave Candlestick pattern. However, the volume of the morning session has not shown a clear improvement, reflecting the investors’ hesitation.
Currently, the index is secondary testing the Fibonacci Retracement level of 61.8% (equivalent to the range of 1,275-1,285 points) in the context of MACD still giving sell signals, indicating that the short-term prospects are still not optimistic.
Technical Signals of HNX-Index
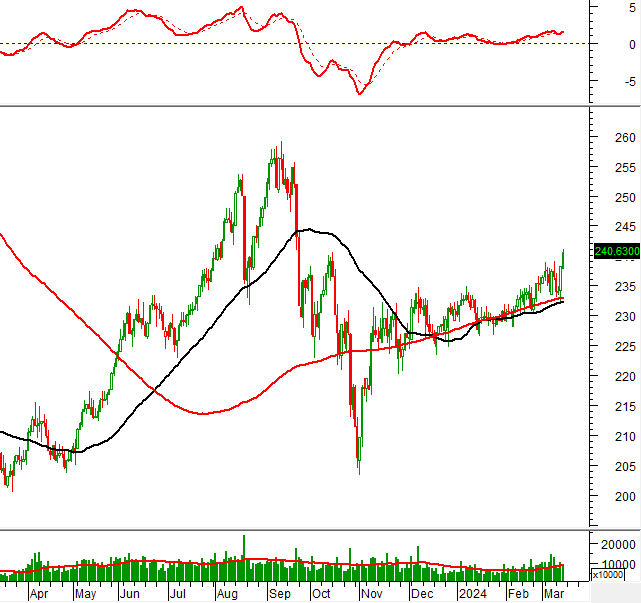
In the trading session on March 14, 2024, HNX-Index continued to increase in points with a trading volume expected to exceed the 20-day average, which showed the investors’ optimistic sentiment.
On the other hand, the MACD indicator continues to trend upwards and has given a buy signal, indicating that the upward momentum is being reinforced.
PVT – Petrovietnam Transportation Corporation
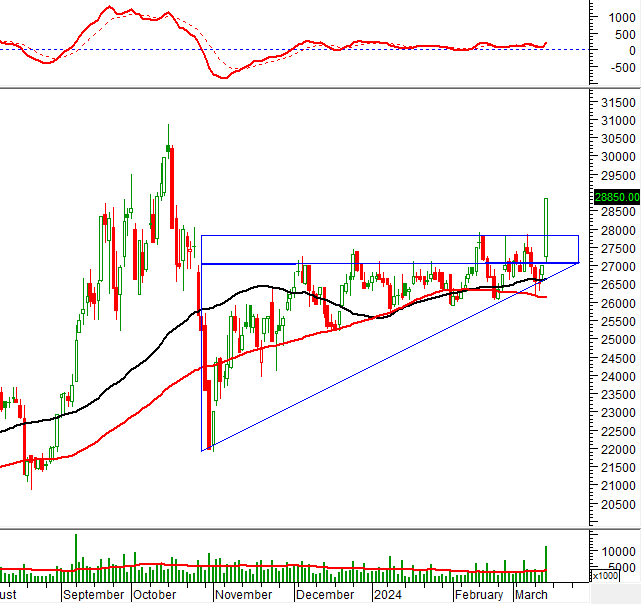
In the morning session on March 14, 2024, PVT stock formed the Rising Window candlestick pattern with a sudden increase in trading volume, showing the investors’ interest.
In addition, the MACD indicator continues to trend upwards after giving a buy signal, indicating that the positive long-term outlook still exists.
The stock price continues to rise after the appearance of the Golden Cross between the 50-day SMA and the 100-day SMA, while breaking above the upper boundary (equivalent to the range of 27,300-28,000) of the Ascending Triangle pattern. If the recovery trend is maintained, the next potential target is 31,400-32,100.
VIX – VIX Securities Corporation
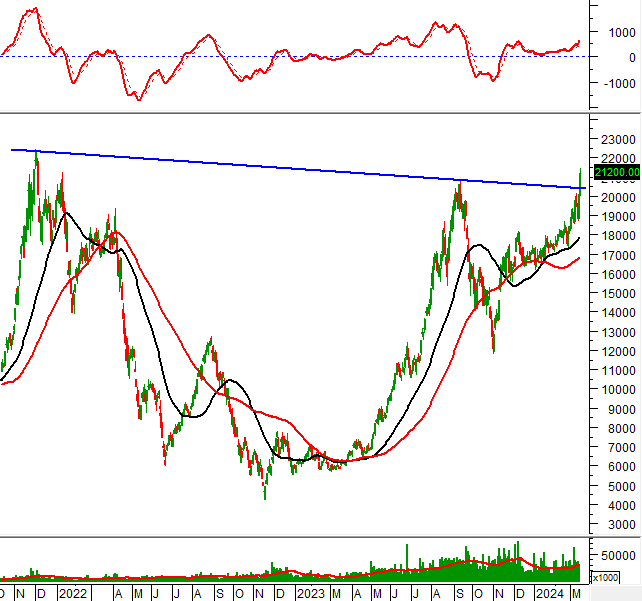
In the morning trading session on March 14, 2024, the price of VIX stock increased significantly and surpassed the previous peak in September 2023, indicating the investors’ optimistic sentiment.
The trading volume is expected to exceed the 20-day average at the end of the trading session, showing the dynamic activity of investors.
In addition, the stock price has surpassed the Neckline (equivalent to the range of 20,000-21,000) of the Cup and Handle pattern. If the stock price successfully tests the Fibonacci Projection level of 61.8%, the potential target price is 38,000-40,000.
Technical Analysis Department, Vietstock Advisory

