Banks, as financial intermediaries, have always considered lending as their primary source of revenue. However, this is also the source of greatest risk, especially when credit expansion occurs too rapidly and ineffectively. Assessing and controlling credit risk is essential to ensure the stability and safety of banking operations. Consequently, monitoring indicators of financial health, particularly factors related to the safety of loan portfolios, is a concern not only for bank managers but also for investors.
When assessing with the aim of predicting the portfolio risk of individual banks and of the entire system as a whole, we need to distinguish between a group of indicators with predictive capability (what we really need) and indicators that only serve to confirm what has already happened. Predictive indicators are important because they can provide us with additional information to forecast what will happen next in the financial health of banks.
Limitations in the measurement of current indicators
In 2023, credit accelerated from 7% at the end of September to the target growth of 14% for the year. In the fourth quarter alone, credit increased by 17.7% year-on-year for the 27 listed commercial banks, while bad debt decreased from 2.24% in the third quarter to 1.93%. However, the bad debt ratio only reflects a part of the bank’s credit risk, as this indicator does not show the risk associated with new loans added during the period. By increasing the volume of new credit faster than the increase in bad debt, banks can reduce the bad debt ratio. When repayment is due and bad debts arise, the risk of new credit is reflected in the banks’ financial statements. Therefore, assessing the quality of bank loans based solely on the ratio of bad debt is inappropriate and lacks predictive value.
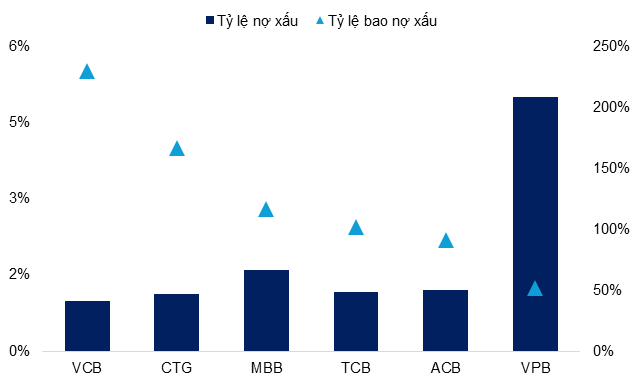
In addition, we need to consider the risk in the structure of banks’ loan portfolios. With different lending strategies, banks have a wide range of bad debt ratios. VCB has the lowest bad debt ratio in the system (0.93% at the end of Q4/2023) thanks to its prudent lending policy. Meanwhile, banks lending to corporates such as MBBank and Techcombank have a higher rate of bad debt. Within the same strategy group of lending to individuals and SMEs, ACB and VPB have a clear difference in bad debt ratios. Finally, the bad debt ratios of small-scale joint-stock commercial banks will also be much higher than those of the other groups.
Another indicator commonly used to assess the quality of a bank’s loan portfolio is the loan loss coverage ratio. This indicator is measured by taking the value of provisions made by the bank divided by the total bad debt. The higher this ratio, the better the quality of the bank’s loan portfolio, as it indicates prudent provisioning. A sharp drop in the coverage ratio is a sign of reduced provisioning. This decline is reflected in banks optimizing costs to improve their short-term profit reporting. Looking at the coverage ratio, we can only see to some extent how prudent or less prudent banks are in making provisions, rather than changes in the banks’ asset strategy.
|
Bad and Loan Loss Coverage Ratios at the End of Q4/2023
Source: Capital IQ
|
In the current context, as the banking industry faces significant macroeconomic fluctuations, we need earlier warning indicators that can reflect potential risk changes in banks’ loan portfolio structure and off-balance sheet activities. These indicators help banks identify and adjust their strategies, reshape their loan portfolios to minimize risk before they become too large. For example, shifting credit from higher-risk sectors to priority and manufacturing sectors can be an effective strategy.
The usefulness of the RWA/Total Asset Ratio
Basel II and Circular 41/2016/TT-NHNN in Vietnam set out important regulations for managing financial risk for banks. This regulation requires banks to maintain a capital adequacy ratio of at least 8%, with the capital adequacy ratio adjusted for the ratio of equity capital to total risk-weighted assets. When assessing the risk level of a bank’s asset portfolio, the bank will not use the total asset value but will use the risk-adjusted total asset value. In that case, for each type of bank asset and off-balance sheet item, the regulation provides a corresponding risk coefficient. Since different banks will have loan portfolios with different risk levels, a home loan will have a very different risk level than commercial real estate loans. Through the risk-adjusted total asset size, the inherent risks in a bank’s operations are clearly reflected. Based on the RWA/Total Asset ratio, managers can directly compare banks on the basis of risk-adjusted portfolio conversion to a benchmark, making it easier for referencing and managing.
|
Risk-weighted Assets RWA and CAR of Banks in 2022
Source: Synthesis
|

According to the table of banks’ RWA ratios in 2022, VCB has a low RWA/total asset ratio thanks to its prudent lending strategy and ability to select a good customer base. ACB Bank has a low RWA/total asset ratio thanks to the selective development of a customer base of individuals and SMEs. In addition, ACB Bank’s off-balance sheet activities are relatively low compared to the bank’s total assets, at about 25% of total assets. MBB, TCB and VPB have strong development in off-balance sheet activities, as well as in the customer base of businesses and real estate consumers, so they have the highest RWA/total asset ratios.
|
Techcombank’s RWA/Total Assets Ratio Over Time
|
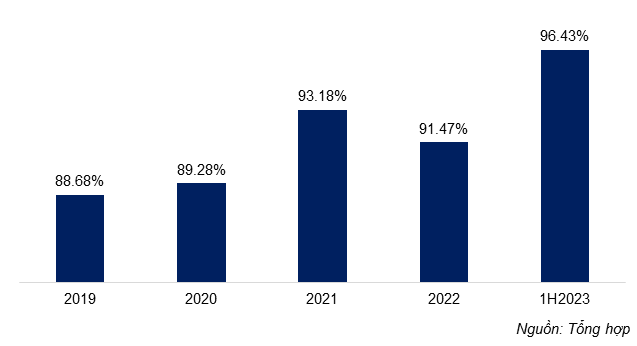
The RWA/Total Assets ratio also reflects the shift in banks’ operating strategies. During the period 2019-2021, Techcombank’s RWA/total asset ratio increased over the years and peaked at 93.18% in 2021. In 2022, TCB shifted its credit portfolio from the large corporate group to the retail and SME customer group with a retail credit portfolio growth of up to 40%. The strategy of selectively pushing retail lending helped TCB better diversify its risk, and the RWA ratio began to decline slightly to 91.47%.
By 2023, credit activities still faced many difficulties, especially in the first three months of the year. The demand for loans mainly came from real estate businesses in need of capital to maintain their operations. It is clear that in the first 9 months of 2023, real estate business credit in the system grew by nearly 22%, higher than the overall credit growth rate (nearly 7%). TCB‘s semi-annual RWA/total asset ratio increased, with credit risk assets in the real estate business increasing by more than 20% compared to the end of 2022. Monitoring the changes in the above RWA/asset ratio helps us assess more specifically the bank’s strategic asset moves, thereby reflecting the specific customer loan portfolio risk.
Recent developments in the domestic and global economy, as well as competition for credit growth, will require banks to prepare for operating strategies and develop risk management plans in advance. The RWA tool will continue to be a reliable indicator for banks to decide their risk appetite and reconsider their effective portfolio in the coming period, especially in the context that traditional assessment indicators are facing many difficulties due to current subjective and volitional provisioning policies.
Le Hoai An, CFA – Nguyen Quang Ngan


