In the increasingly competitive landscape of credit growth, banks have adopted distinct strategies, customer segmentation, and development approaches based on their advantages and resources. This has led to a differentiation in valuations among banks based on their chosen business models. To analyze this differentiation more clearly, we will categorize the currently listed banks into four groups according to their characteristics and operating strategies, including state-owned commercial banks, private commercial banks specializing in corporate lending, private commercial banks specializing in retail lending, and other private banks.
Recognizing banks by their strategic group has significant implications, particularly when comparing valuations between banks. Simply comparing banks from different strategic groups to assess whether they are undervalued or overvalued may not be appropriate.
Valuation multiples differ across bank groups
The Price to Book Ratio (P/B) is a key metric in valuing bank stocks. Book value holds significant importance in valuing banks because their assets and liabilities are financial assets, so book value reflects the market value of the portion of shareholder equity that the bank employs in its operations. A higher P/B ratio reflects the market’s expectations of banks’ earning potential and the level of underlying risk.
In 2023, the banking sector’s P/B ratio remained below its average level over the past decade. Amidst the uncertain credit growth and increased risk of bad debt, business strategy will significantly impact banks’ valuations. Banks with sound business strategies will have good growth potential and low risk in the future, thus influencing their valuations in the market.
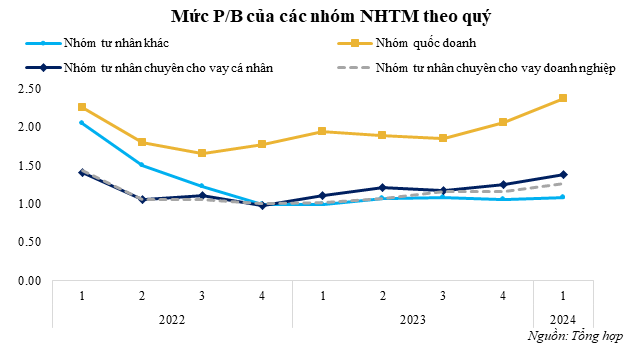
Valuations vary significantly across bank groups. The state-owned bank group, including Vietcombank, BIDV, and VietinBank, has a much higher P/B ratio than the group of private banks. On the one hand, state-owned banks benefit from scale and high reputation due to their ownership by the State Bank of Vietnam (SBV), leading to a higher P/B. On the other hand, these banks consistently have the lowest non-performing loan ratio in the system due to their advantage in selecting a good customer base, along with stable annual profit growth, resulting in state-owned commercial banks’ stocks being consistently highly valued. Conversely, the private bank group has a low and fluctuating P/B ratio over the years. Private banks specializing in retail lending, such as ACB, Sacombank, VIB, and private banks specializing in corporate lending, such as MBB, TCB, MSB, have P/B ratios ranging from only 1 to 1.5 times. With a business model heavily focused on the ecosystems of corporate clients, private banks specializing in corporate lending tend to have lower valuations.
Meanwhile, the lowest valuations belong to the group of banks with small scale, lack of advantage in lending rates, high input costs, and unclear development strategies that put them at a disadvantage when competing with the three major bank groups. Therefore, despite having relatively high valuations in early 2022, the P/B ratio gradually adjusted to align with the potential asset quality and profitability that this group could deliver, recording a low of 1.08 times at the end of the first quarter of 2024.
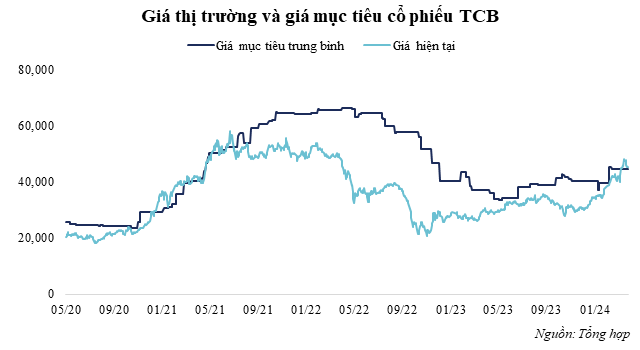
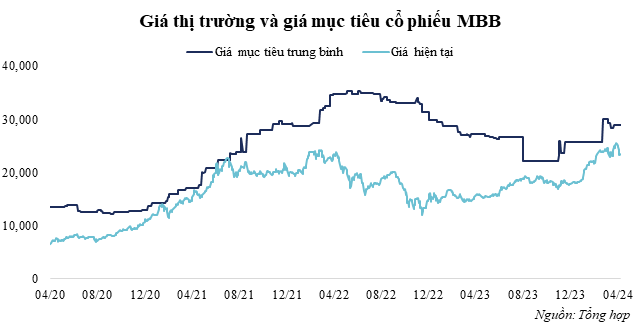
The ultimate goal of the P/B method is to assess a bank’s intrinsic value based on its book value. However, in practice, this method can lead to biases when the comparison is based solely on simple average P/B ratios. Consider the example below for the bank stocks MBB and TCB. Data collected on the target valuations of these two stocks by brokerage firms often show significant discrepancies with their market prices. This indicates the market’s over-optimism about these banks, often based on factors such as projected credit growth or market expansion, without adequately considering financial risks and macroeconomic factors. Therefore, to estimate a reasonable P/B, we need to delve deeper into the banks’ strategic growth factors and assess their feasibility in the real-world context, thereby mitigating the pitfalls in the valuation process.
Valuation traps when using the comparative approach
Comparing banks from different strategic groups often leads to valuation traps. This occurs because the average P/B ratio determined for the banking sector may not accurately reflect the value of banks in a different strategic group. Over the past year, the P/B ratio has varied significantly among commercial banks, with the industry average fluctuating. This variation makes it challenging for investors to assess the true value of banks when relying solely on a few common parameters. Comparing banks from different groups in terms of valuation can be akin to comparing a house on a main street to a house in an alley. Banks focused on corporate business may have higher risks but also higher earning potential than banks catering to retail customers. These specific risks and opportunities inherent in their business strategies shape banks’ valuations, leading to marked differentiation in their assessment and investment on the financial market.
|
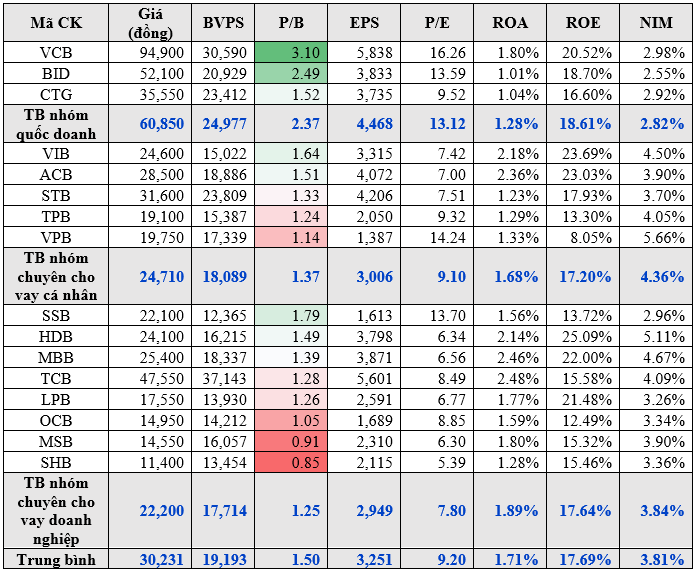
Financial indicators of banks in Q1/2024
Source: Author’s compilation
|
To illustrate, consider the table comparing P/B and P/E valuations of bank stocks in the recent quarter. The data shows that the average valuations hold little significance when using a simple comparative approach. The differences in business strategies among state-owned and private banks, and between corporate and retail lending portfolios, have implications for the level of risk and opportunity, and therefore, the valuation. The average P/B ratio for the state-owned group is 2.37 times. If we apply the industry-average P/B of 1.5 times to corporate lending bank stocks, it would be inappropriate. The valuation for this group typically ranges between 0.9 and 1.3 times at most. In terms of growth potential, private banks generally have the highest ROA and NIM in the system. Basing valuations solely on headline figures without in-depth understanding can hinder the identification of sound investment opportunities.
Understanding the strategies of bank groups is crucial for determining their appropriate valuations. Clear recognition of the differences in business models and associated risks is key to accurately assessing each bank’s value in the current financial market landscape. Investors should be cautious of valuation traps arising from inappropriate use of comparative approaches, leading to more informed investment decisions.
Le Hoai An, CFA – Nguyen Thi Ngoc An, HUB


