Technical Signals for the VN-Index
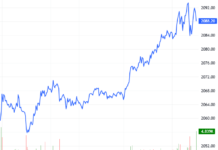
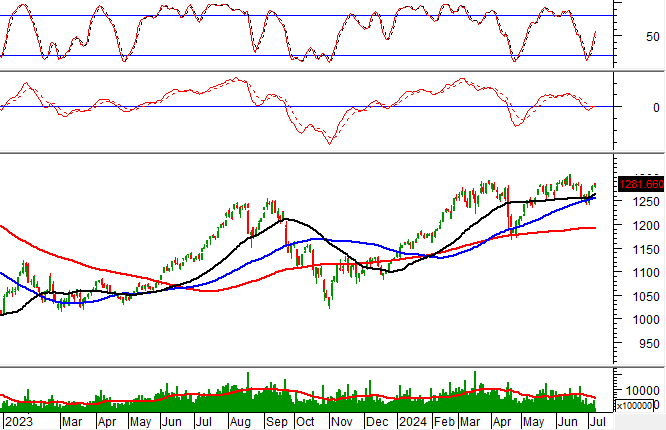
During the trading session on the morning of July 8, 2024, the VN-Index witnessed a decline, while trading volume surged, indicating a rather pessimistic investor sentiment.
Additionally, the VN-Index is finding decent support from the group of 50-day and 100-day SMA lines, as the MACD indicator flashes a buy signal, suggesting that mid-term optimism remains intact.
Technical Signals for the HNX-Index
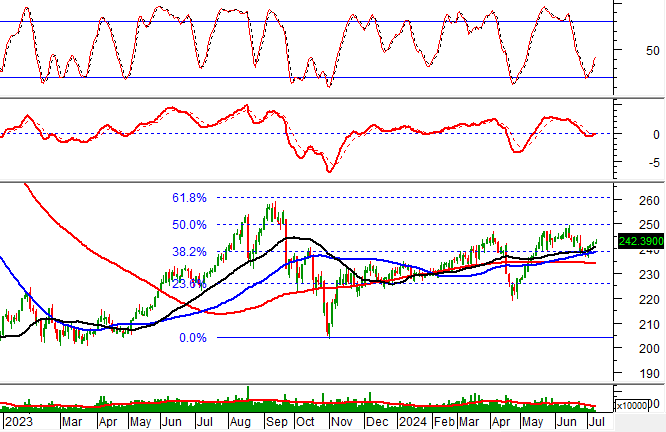
On July 8, 2024, the HNX-Index posted a slight gain and an Inverted Hammer candlestick pattern emerged, alongside a robust increase in morning trading volume, reflecting investors’ indecision.
Furthermore, the HNX-Index is testing the Fibonacci Projection 38.2% threshold (equivalent to the 238-242 point region) as the MACD gradually narrows its gap with the Signal line. Should a buy signal reappear, a short-term recovery scenario could unfold in upcoming sessions.
DCM – Ca Mau Petroleum Fertilizer Joint Stock Company
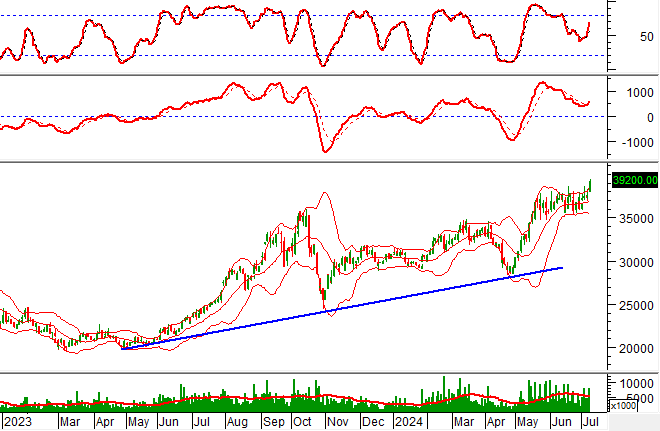
On the morning of July 8, 2024, DCM witnessed a sharp price increase, forming a long-bodied candlestick pattern, while trading volume surged, surpassing the 20-session average, indicating optimistic investor sentiment.
Additionally, the stock price rebounded after successfully testing the Middle line of the Bollinger Bands, as the Stochastic Oscillator continues climbing, reinforcing the bullish momentum following a prior buy signal.
DXS – Dat Xanh Real Estate Service Joint Stock Company
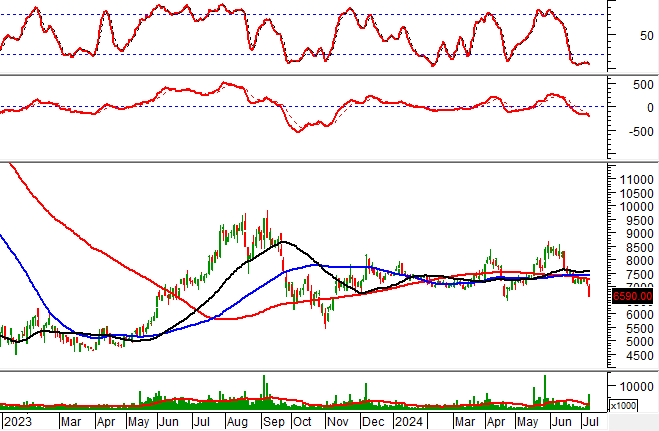
During the morning session of July 8, 2024, DXS plummeted to its daily limit-down price, forming a Black Marubozu candlestick pattern, as trading volume surpassed the 20-session average, reflecting negative investor sentiment.
Furthermore, the stock price fell below the SMA 200-day line (equivalent to the 7,100-7,400 region) while the MACD indicator continues to widen its gap with the Signal line after a prior sell signal, indicating long-term pessimism.
Technical Analysis Department, Vietstock Consulting


