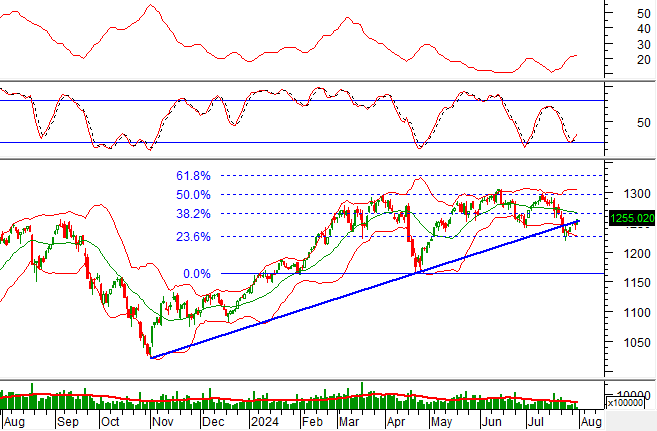
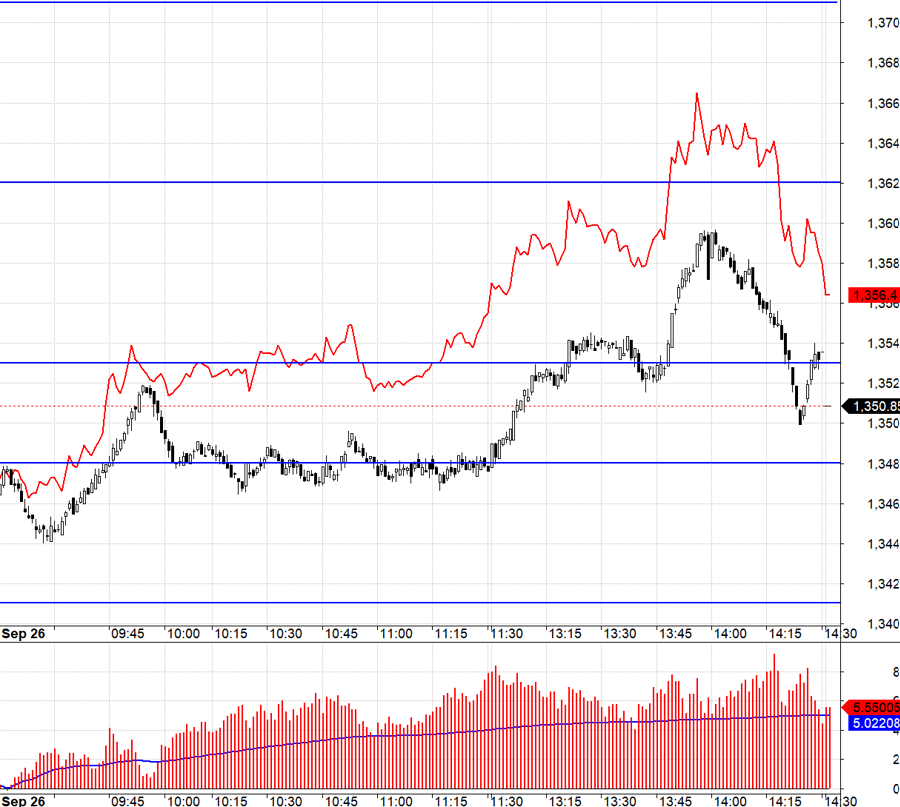
The VN-Index closed the 29th trading week of 2024 at 1,264.78 points, a slight decrease of 15.97 points or 1.25% from the previous week, with flat liquidity after a strong increase in week 27.
The average trading value of the three sessions this week reached VND 22,253 billion. Specifically, the matched orders trading value averaged VND 20,098 billion, up 2.3% from the previous week but still 1.9% lower than the 5-week average.
There were 3 out of 5 decreasing sessions last week, and selling pressure dominated, even touching a record high of over 182.53 million shares on July 17th, 2024, before the ATC session. Active selling was widespread across both capitalization and industry sectors. Conversely, active buying typically remained low.
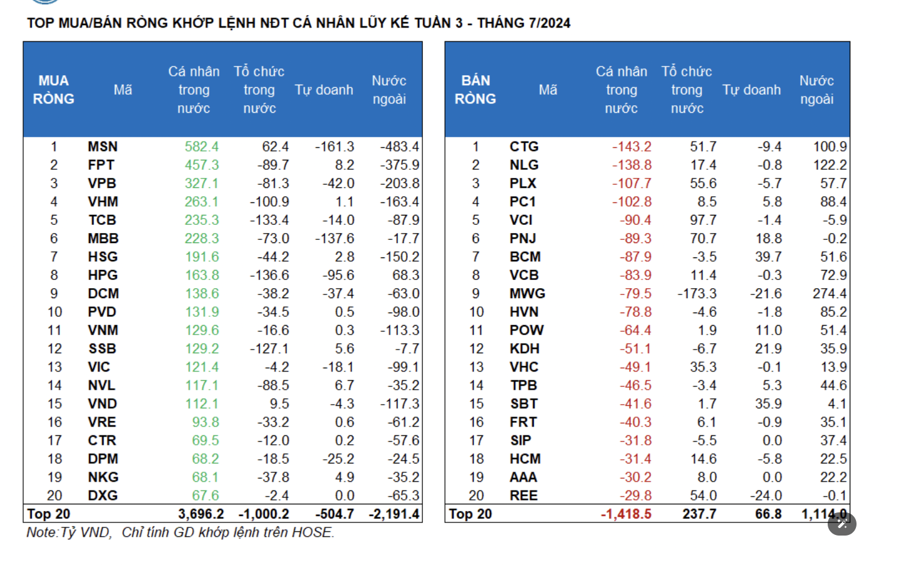
Foreign investors net sold VND 778.2 billion, and their net selling value of matched orders was VND 1,275.6 billion. The main sector that foreign investors net bought was Retail, Tourism, and Entertainment. The top stocks that foreign investors net bought by matched orders were MWG, FUEVFVND, NLG, CTG, PC1, HVN, VCB, STB, HPG, and PLX.
On the selling side, their top net sell by matched orders was in the Food and Beverage sector. The top stocks that foreign investors net sold were MSN, FPT, VPB, VHM, HSG, VNM, VIC, PVD, and TCB.
Individual investors net bought VND 2,596.6 billion, of which VND 3,083.4 billion was from order matching.
Looking at matched orders, they net bought 11 out of 18 sectors, mainly in Banking. The top stocks that individual investors net bought were MSN, FPT, VPB, VHM, TCB, MBB, HSG, HPG, DCM, and PVD.
On the selling side, they net sold by matched orders in 7 out of 18 sectors, mainly in Retail, Personal & Household Goods. The top stocks that individual investors net sold were CTG, NLG, PLX, PC1, VCI, PNJ, VCB, MWG, and HVN.
Domestic institutional investors net sold VND 1,022.2 billion, and their net selling value of matched orders was VND 1,050.8 billion. Domestic institutions net sold by matched orders in 10 out of 18 sectors, with the highest value in Real Estate. The top stocks that domestic institutions net sold were MWG, HPG, TCB, SSB, FUEVFVND, VHM, FPT, NVL, VPB, and MBB.
The sector with the highest net buying value was Personal & Household Goods. The top stocks that domestic institutions net bought were VCI, PNJ, ACB, MSN, PLX, REE, CTG, VHC, FUESSVFL, and HDG.
Proprietary trading net sold VND 796.1 billion, and their net selling value of matched orders was VND 757 billion. Looking at matched orders, proprietary trading net bought 6 out of 18 sectors. The sectors with the strongest net buying were Real Estate, Industrial Goods & Services. The top stocks that proprietary trading net bought today were BCM, KBC, SBT, KDH, PNJ, DGC, E1VFVN30, POW, GMD, and VTP.
The top net sell sector was Banking. The top stocks that were net sold were MSN, MBB, HDB, HPG, STB, ACB, VPB, GVR, DCM, and DPM.
From a weekly perspective, the money flow allocation ratio recovered from the bottom in Banking and Securities; increased in Retail, Electricity, Aviation, and Electrical Equipment; and decreased to the bottom in Food, Construction, Agricultural & Seafood, and Warehousing & Logistics.
The highlight of this week’s money flow was the Banking sector, as the allocation ratio unexpectedly recovered strongly from a 10-week low to a 10-week high. The Banking sector index went against the overall market, increasing by 2.23%.
Some sectors with increasing money flow allocation ratios include Securities, Electricity, and Aviation. However, the price indices of these three sectors all decreased. Conversely, Steel, Chemicals, Oil & Gas Production, and Water Transport recorded decreases in both price and money flow allocation ratios.
Money Flow Strength: Looking at the weekly frame, the large-cap VN30 group attracted strong money flow again, while the allocation ratio decreased in the mid-cap VNMID and small-cap VNSML groups.
In week 29, the allocation ratio in the large-cap VN30 group increased significantly to 48.3%, and VN30 continued to attract money flow for the sixth consecutive week. In contrast, the allocation ratio decreased in the mid-cap VNMID group to 35.3% and the small-cap VNSML group to 11.3%.
In terms of money flow size, the average trading value of the large-cap VN30 group increased by 10.8% (+VND 915 billion). Meanwhile, the average liquidity of the mid-cap and small-cap groups decreased by 10.6% (-VND 819 billion) and 8.7% (-VND 211 billion), respectively.
In terms of price movements, the VNMID and VNSML indices decreased by 2.5% and 3.18%, respectively. Conversely, the VN30 index went against the market, slightly increasing by 0.04%.

