


: Returning to Critical Support Levels?")


STOCK MARKET REVIEW FOR THE WEEK OF 22-26/07/2024
During the week of July 22-26, 2024, the VN-Index continued its decline and failed to recover from the previous trading week. Investor caution persisted as trading volume remained below the 20-week average.
Additionally, the MACD and Stochastic Oscillator indicators continued their downward trajectory, providing sell signals. This suggests that the short-term outlook for the index remains bearish.
TECHNICAL ANALYSIS
Trend and Price Oscillation Analysis
VN-Index – Re-testing the Neckline of a Double Top Pattern
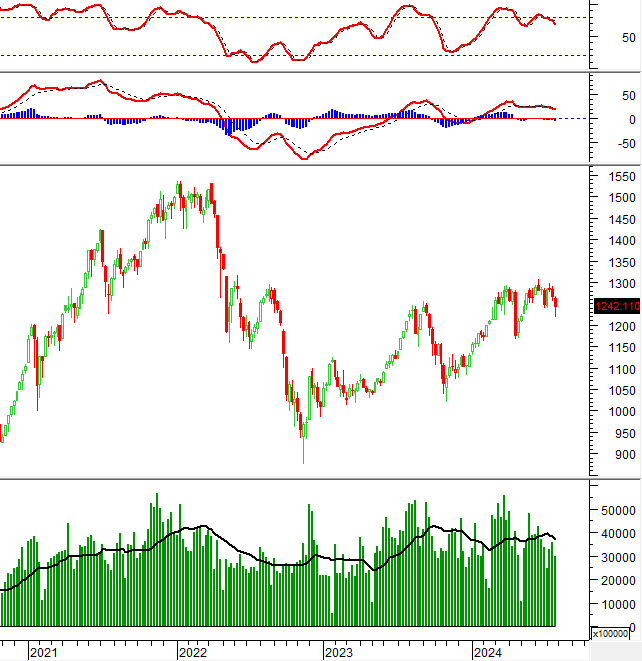
On July 26, 2024, the VN-Index gained but remained below the Middle Bollinger Band, indicating a continued bearish short-term outlook. The MACD indicator continued its downward trajectory and remained below zero, while trading volume stayed below the 20-day average, suggesting that the corrective phase is still in play.
Currently, the VN-Index is re-testing the Neckline (1,235-1,255 points) of a Double Top pattern. If the situation does not improve and the correction extends, the potential price target could be the 1,165-1,185-point region, which also coincides with the April 2024 lows.

HNX-Index – Bullish Engulfing Candle Pattern Emerges
On July 26, 2024, the HNX-Index rose and formed a Bullish Engulfing candle pattern after testing the 200-day SMA, indicating optimistic investor sentiment. However, the index remains below the Middle Bollinger Band, and the MACD indicator is still below zero, suggesting that a short-term recovery is not yet imminent.
Additionally, the HNX-Index is approaching a medium-term trendline support, which coincides with the 50% Fibonacci Retracement level (approximately 228-233 points). Therefore, the index is likely to find strong support at this level in the near term.

Money Flow Analysis
Smart Money Flow Variation: The Negative Volume Index for the VN-Index dipped below the 20-day EMA. If this condition persists in the next session, the risk of a sudden downturn (thrust down) will increase.

Technical Analysis Department, Vietstock Consulting


