MARKET REVIEW FOR THE WEEK OF 07/29-08/02/2024
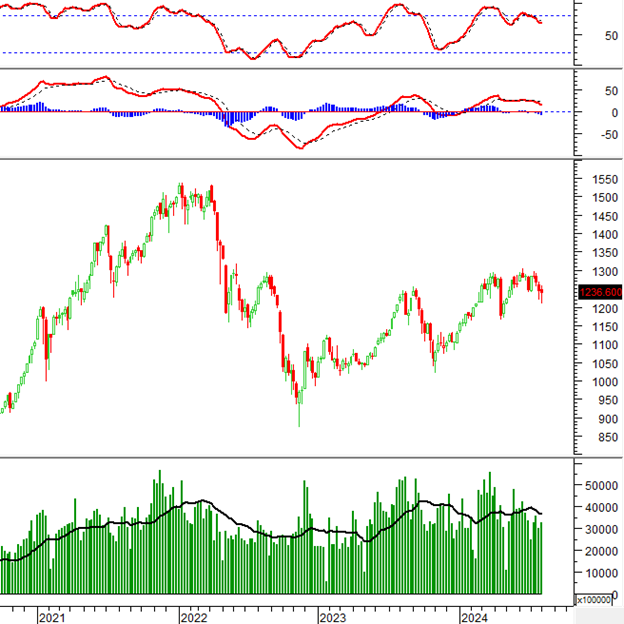
During the week of 07/29-08/02/2024, the VN-Index continued its downward trend, forming a Three Black Candles pattern, indicating investors’ persistent pessimism. This suggests that the downward momentum is likely to persist in the short term, as the Stochastic Oscillator and MACD indicators show a downward trajectory after issuing sell signals.
Moreover, trading volume remained below the 20-week average, further dampening the index’s prospects for recovery.
TECHNICAL ANALYSIS – TREND AND PRICE OSCILLATION
VN-Index – MACD Indicates Downward Trend
On 08/02/2024, the VN-Index witnessed a slight increase after testing the Fibonacci Projection 23.6% level (corresponding to the 1,210-1,235 point range), with trading volume above the 20-day average. This reflects a slight improvement in investor sentiment.
However, the index remains close to the Lower Band of the expanding Bollinger Bands, and the MACD indicator continues to trend downward and stays below zero, suggesting that a return to optimism in the short term is unlikely.

HNX-Index – Stochastic Oscillator Shows Bullish Divergence
On 08/02/2024, the HNX-Index rose but remained below the Middle Bollinger Band, while trading volume decreased compared to the previous session, indicating investors’ hesitation. The index rebounded after testing the mid-term trendline support, and the Stochastic Oscillator indicates a potential bullish divergence.
If the Stochastic Oscillator generates a buy signal, the prospects for a recovery may improve.

ANALYSIS OF CAPITAL FLOW
Movement of Smart Money: The Negative Volume Index for the VN-Index crossed above the 20-day EMA. If this trend persists in the next session, the risk of a sudden downturn (thrust down) will diminish.

Technical Analysis Department, Vietstock Consulting


