Technical Signals for the VN-Index
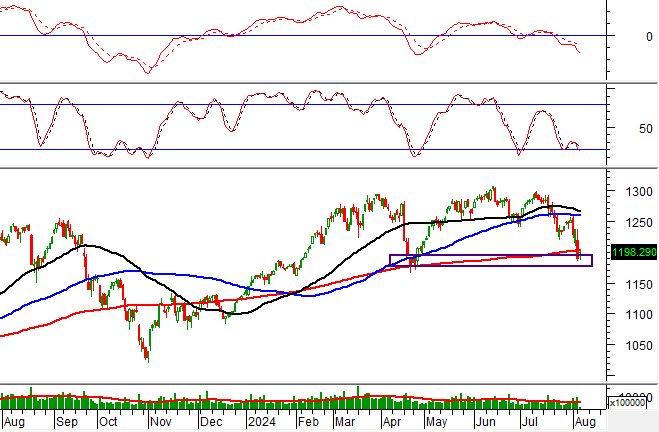
During the morning trading session of August 6, 2024, the VN-Index witnessed a rise in points and displayed a candle pattern resembling a High Wave Candle. This occurred alongside a slight increase in trading volume, indicating the investors’ dilemma.
At present, the VN-Index is retesting the old bottom of April 2024 (equivalent to the 1,175-1,195-point region) while the Stochastic Oscillator indicator continues its downward trajectory after previously giving a sell signal. If this sell signal is maintained and the index falls out of this support region, the risk of adjustment will heighten in the upcoming sessions.
Technical Signals for the HNX-Index
On August 6, 2024, the HNX-Index witnessed a rise in points, accompanied by a slight increase in trading volume during the morning session, indicating a shift in investor sentiment from pessimistic to less pessimistic.
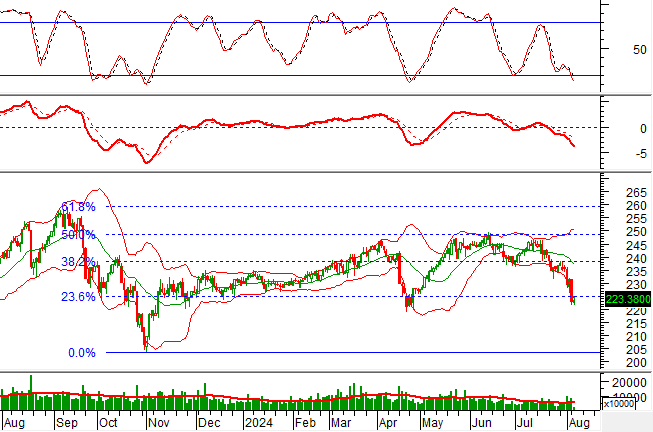
Additionally, the HNX-Index is retesting the Fibonacci Projection 23.6% threshold (equivalent to the 221-226-point region) while the MACD indicator continues its downward trajectory after previously giving a sell signal, suggesting that the short-term adjustment trend will likely persist in the upcoming sessions.
NHA – Hanoi Housing Investment and Development Corporation
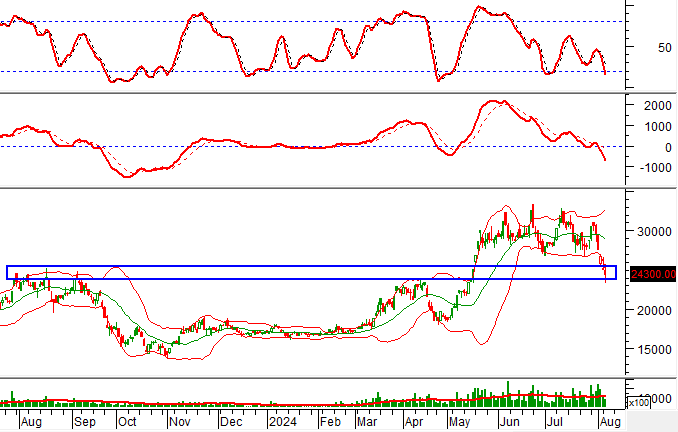
During the morning session of August 6, 2024, NHA continued its downward price trend, accompanied by a significant increase in trading volume, reflecting the investors’ pessimistic sentiment.
Moreover, the stock price remains closely aligned with the lower band of the Bollinger Bands, and the MACD indicator is consistently widening the gap with the signal line after previously giving a sell signal. This suggests that the adjustment phase is likely to extend into the upcoming sessions.
VGT – Vietnam National Textile and Garment Group
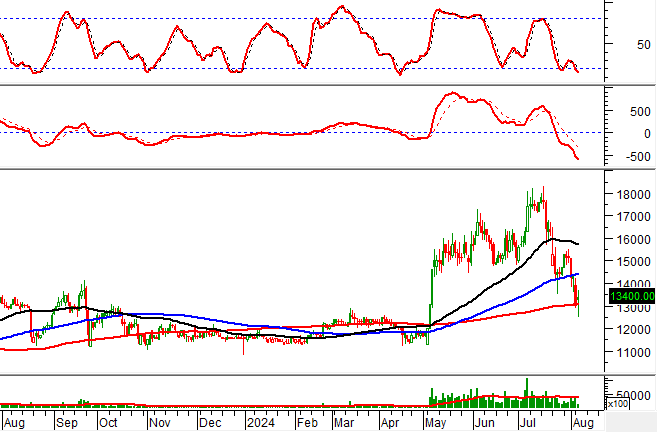
On the morning of August 6, 2024, VGT witnessed a rise in price and displayed a High Wave Candle pattern, along with a slight increase in trading volume, indicating the investors’ dilemma.
Additionally, the stock price is retesting the SMA 200-day line while the Stochastic Oscillator indicator continues its downward trajectory, venturing deeper into the oversold region. Should a buy signal emerge, the prospects for recovery may return in the upcoming sessions.
Technical Analysis Department, Vietstock Consulting

