Technical Signals for the VN-Index
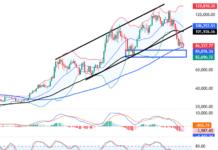
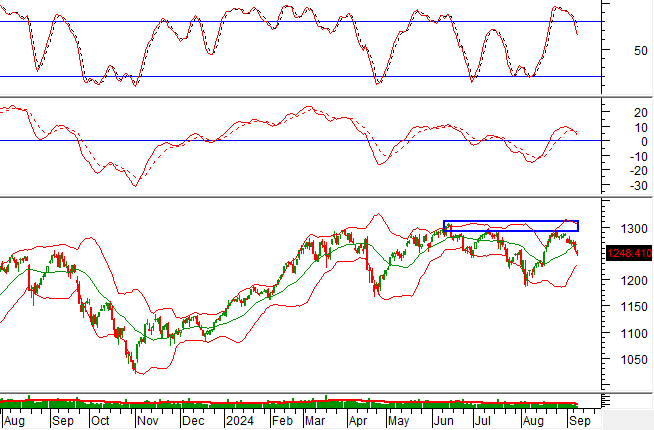
In the trading session on the morning of September 11, 2024, the VN-Index witnessed a decline, coupled with trading volume that lacked significant improvement. This indicated investors’ hesitancy.
At present, the VN-Index has dropped below the Middle Bollinger Band, while the Stochastic Oscillator continues to trend downward after previously giving a sell signal, suggesting that the risk of correction persists.
Technical Signals for the HNX-Index
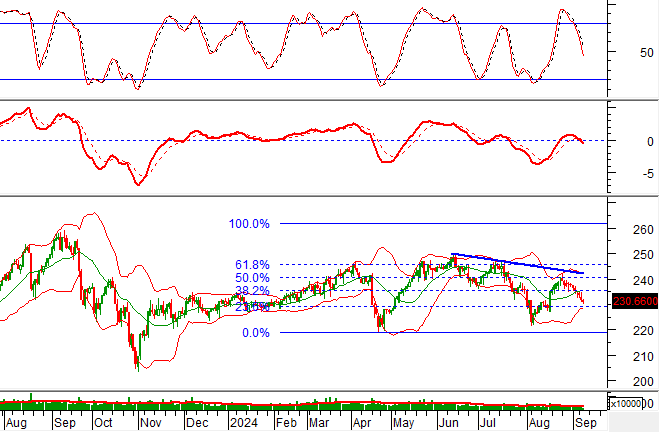
On September 11, 2024, the HNX-Index extended its losing streak to 10 consecutive sessions, with a slight increase in trading volume during the morning session, reflecting investors’ pessimistic sentiment.
Additionally, the HNX-Index is retesting the Fibonacci Projection 23.6% threshold (corresponding to the 226-230 point region) as the MACD indicator maintains a downward trajectory after issuing a prior sell signal. If the index falls below this support level, the risk of further corrections will heighten in upcoming sessions.
TCH – Hoang Huy Finance Service JSC
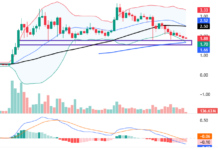
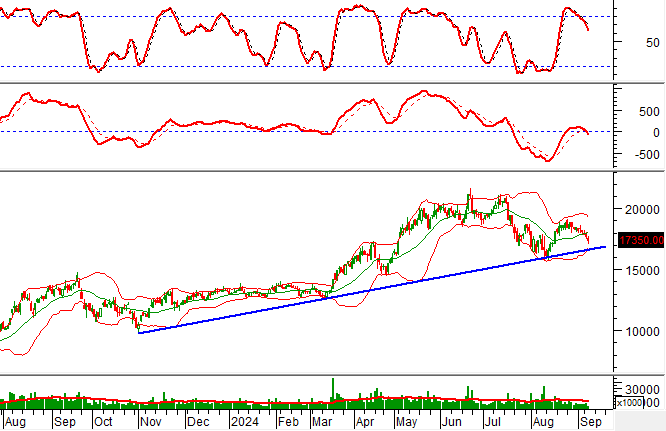
During the morning session of September 11, 2024, TCH witnessed a decline in price alongside a substantial increase in trading volume, indicating investors’ pessimistic outlook.
Furthermore, the stock price has dropped below the Middle Bollinger Band, and the Stochastic Oscillator persists in its downward trajectory after previously giving a sell signal, suggesting that the corrective scenario may extend into upcoming sessions.
VJC – Vietjet Aviation JSC
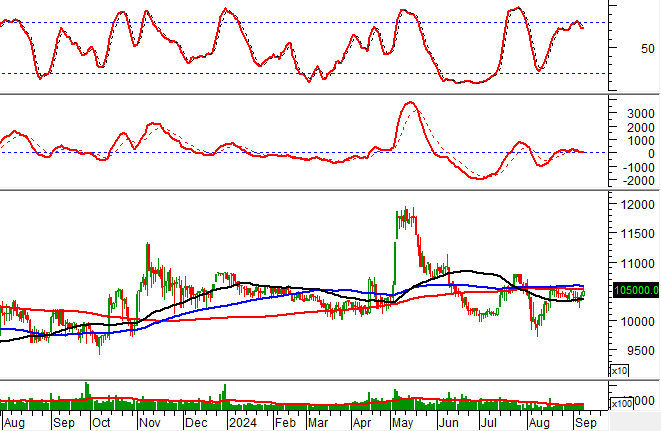
On the morning of September 11, 2024, VJC witnessed a price increase, accompanied by above-average trading volume, indicating a gradual return of investors’ optimism.
Additionally, the stock price is retesting the SMA 50-day and SMA 100-day moving averages, while the MACD indicator has issued a buy signal. Should the stock successfully surpass this resistance level, the positive mid-term outlook will likely resume in upcoming sessions.
Technical Analysis Department, Vietstock Consulting


