Technical Signals for VN-Index
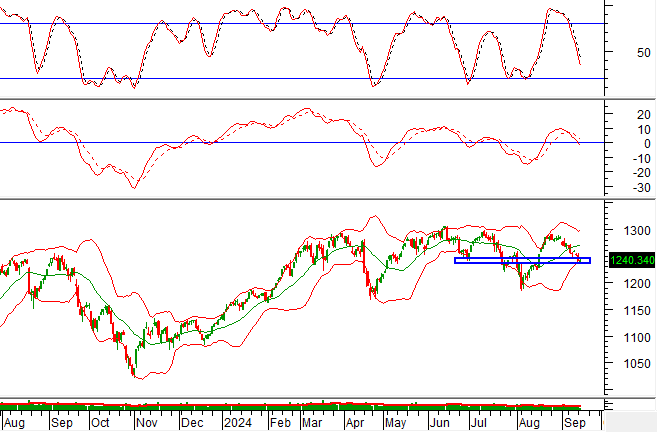
In the trading session on the morning of September 17, 2024, the VN-Index witnessed a slight increase and formed a candle pattern resembling a Doji, indicating investors’ indecision.
Currently, the VN-Index is retesting the old June 2024 low (corresponding to the 1,235-1,245 point region) as the Stochastic Oscillator indicator continues its downward trajectory after previously triggering a sell signal. If the index falls below this support area, the risk of a correction will heighten in the upcoming sessions.
Technical Signals for HNX-Index
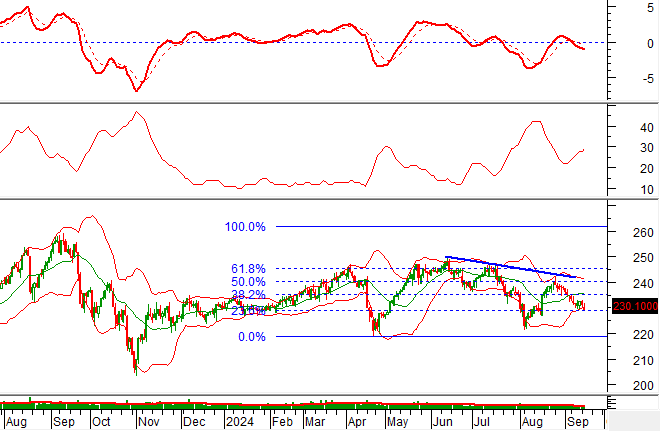
During the trading day on September 17, 2024, the HNX-Index declined, accompanied by a slight increase in trading volume in the morning session, reflecting investors’ uncertainty.
Moreover, the MACD indicator maintains its downward trajectory after previously triggering a sell signal, suggesting that a strong recovery scenario is unlikely in the near term.
NTP – Plastic for Young Pioneers Joint Stock Company
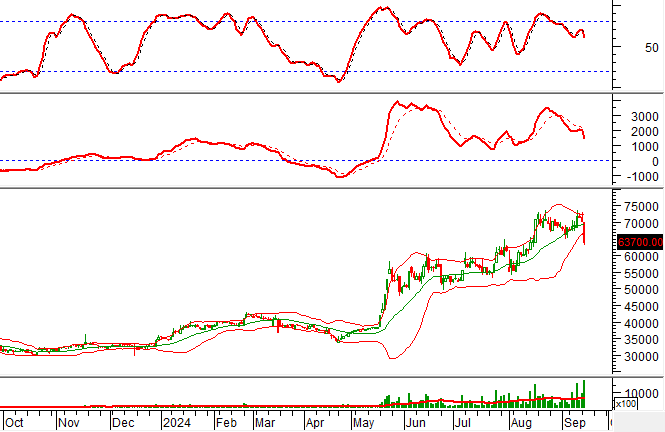
On the morning of September 17, 2024, NTP witnessed a sharp decline and formed a Black Marubozu candle pattern with volume surpassing the 20-session average, indicating investors’ pessimism.
Additionally, the stock price continues to fall after dropping below the Middle line of the Bollinger Bands, and the MACD indicator is consistently widening the gap with the Signal line following a prior sell signal, further reinforcing the short-term corrective trend.
VRE – Vincom Retail Joint Stock Company
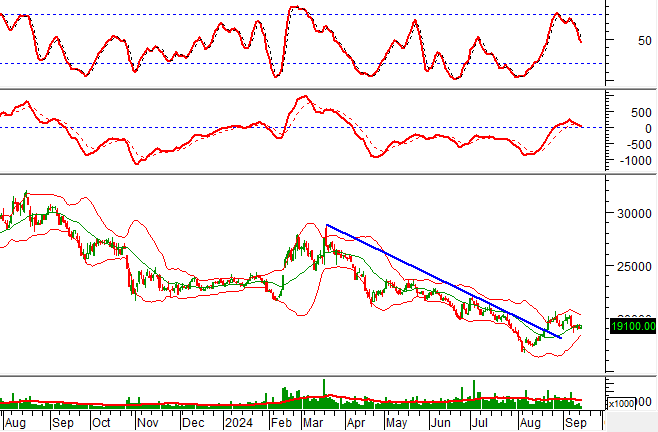
On the morning of September 17, 2024, VRE rose in price, accompanied by a slight increase in trading volume, reflecting investors’ optimism.
Moreover, the stock price is retesting the SMA 50-day line as the Stochastic Oscillator indicator continues downward after triggering a sell signal. Should the stock fall below this support level, the risk of a correction will increase in the upcoming sessions.
Technical Analysis Department, Vietstock Consulting


