


 Mechanism in Urban Areas")


: Mixed Signals Emerge")

: Short-Term Outlook Continues to Deteriorate")
BTC: Strong Support at Fibonacci Projection 61.8%
On the weekly chart, BTC is finding solid support at the 50-day SMA, as evidenced by multiple tests and rebounds, indicating a persistent mid-term bullish outlook.
Additionally, BTC successfully tested the Fibonacci Projection 61.8% level (corresponding to the $53,500-$60,000 USD region) while the MACD indicator narrows the gap with the signal line after previously dipping below it. A resurgence of the buy signal would further bolster the mid-term upward trend.
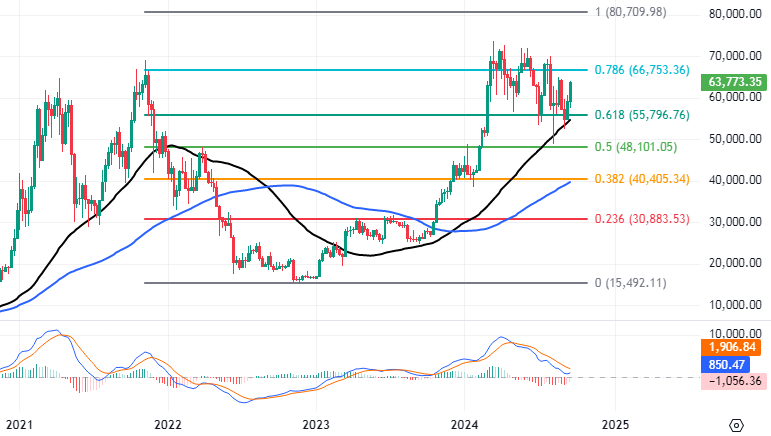
BTC Chart 2021 – 2024 – Source: TradingView
Shifting to the daily chart, BTC is trending towards testing the upper bound of the descending price channel. In a bullish scenario, a successful break above this resistance level would target the $78,000-$80,000 region, coinciding with the aforementioned Fibonacci Projection 100% level.
Currently, the ADX indicator continues to weaken below the 20 level, suggesting potential range-bound conditions and short-term volatility.
Hence, investors are advised to remain cautious and refrain from premature investments until the market provides clearer directional cues.
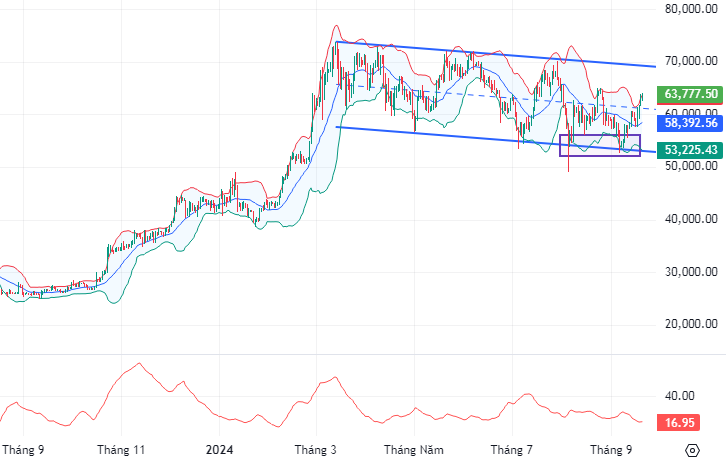
BTC Chart 2023 – 2024 – Source: TradingView
ETH: Long-Term Prospects Intact
On the weekly ETH chart, the rebound from the $1,950-$2,200 USD zone (coinciding with the previous April 2024 high and the long-term trendline) occurs as the MACD indicator continues to drift lower following a prior sell signal, suggesting a fragile recovery and the potential for further choppiness in upcoming sessions.
Moreover, ETH is holding above the 100-day SMA, providing a layer of mid-term support. In a bullish case, sustained upward momentum would reinstate optimism for the mid to long-term horizon.
Based on these signals, ETH is expected to experience choppy conditions before resuming its long-term upward trajectory.
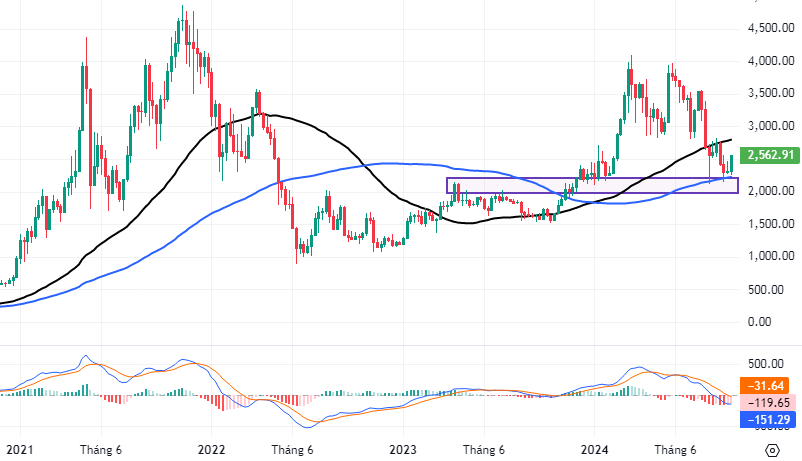
ETH Chart 2021 – 2024 – Source: TradingView
Technical Analysis Department, Vietstock Consulting
FILI


 surges by 70% in a year as it comes closer to the $1 milestone.")