Technical Signals for the VN-Index
During the trading session on the morning of September 27, 2024, the VN-Index gained points, and the improved trading volume during the morning session indicated a positive sentiment among investors.
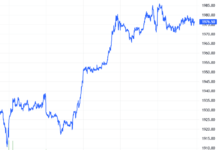
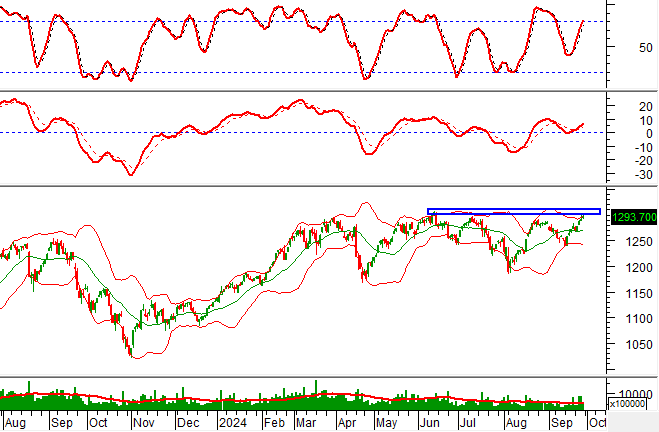
Currently, the VN-Index continues its recovery and is heading towards retesting the old peak from June 2024 (equivalent to the 1,300-1,310 point range) while the MACD indicator is constantly expanding the gap with the Signal line after previously giving a buy signal. A successful breakthrough of this resistance area would further reinforce the optimistic mid-term outlook.
Technical Signals for the HNX-Index
On September 27, 2024, the HNX-Index rose, and the trading volume increased significantly during the morning session. It is expected to surpass the 20-day average by the end of the session, indicating a rather optimistic investor sentiment.
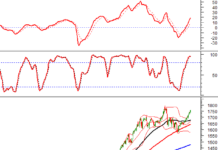
In addition, the HNX-Index successfully tested the Middle line of the Bollinger Bands, while the Stochastic Oscillator indicator maintained its previous buy signal, suggesting that a recovery may occur in the coming sessions.
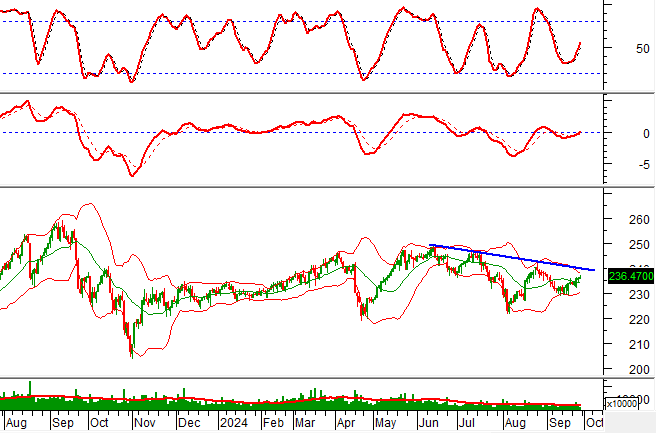
DXG – Real Estate Group Joint Stock Company
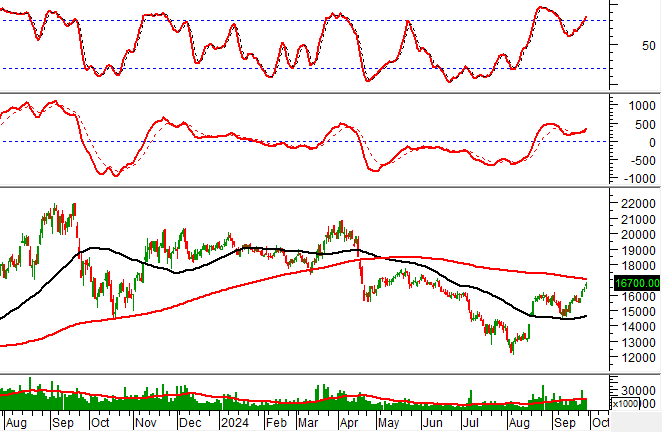
On the morning of September 27, 2024, DXG’s price rose, and the trading volume increased considerably, surpassing the 20-session average and indicating a rather optimistic investor sentiment.
Additionally, the stock price is heading towards retesting the SMA 200-day line while the MACD indicator is constantly expanding the gap with the Signal line after previously giving a buy signal. A successful breakthrough of this resistance level would further reinforce the long-term uptrend.
EIB – Vietnam Export Import Commercial Joint Stock Bank
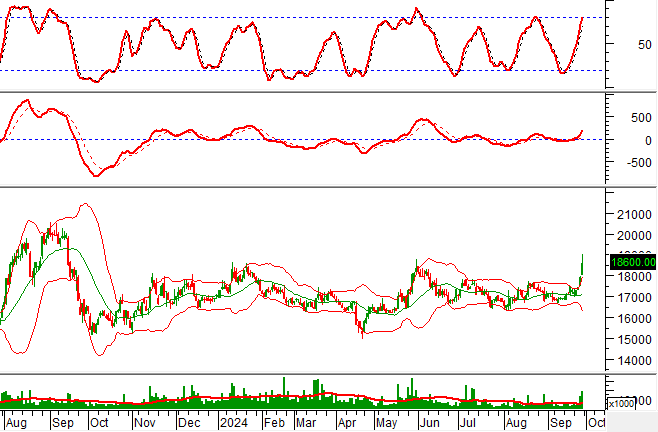
During the morning session of September 27, 2024, EIB surged strongly and formed a Rising Window candlestick pattern, accompanied by liquidity surpassing the 20-session average, indicating active trading among investors.
Furthermore, the stock price is closely following the upper band (Upper Band) of the Bollinger Bands, while the Stochastic Oscillator indicator continues to rise after previously giving a buy signal, further reinforcing the current uptrend of the stock.
Technical Analysis Department, Vietstock Consulting


